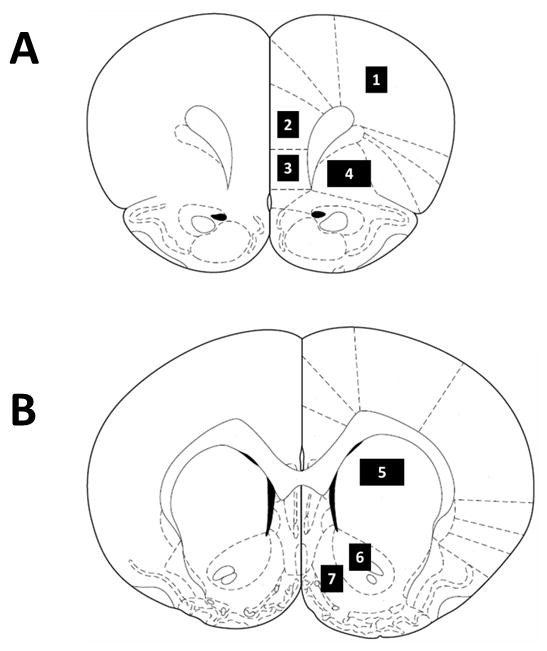
Figure 5.

Schematic representation of coronal sections of the rat brain taken at (A) +3.2 and (B) +1.6 mm from Bregma (Paxinos and Watson, 1998) illustrating the regions in this study as follows: (1) M1 region of the motor cortex (M1); (2) prelimbic cortex (PrL); (3) infralimbic cortex (IL); (4) orbital cortex (Orb); (5) dorsal caudate/putamen (dCPu); (6) nucleus accumbens core (NAcC); (7) nucleus accumbens shell (NAcS). All sample areas were 0.26 mm2, except for Orb and dCPu, which were sampled with 0.52 mm2 areas.
