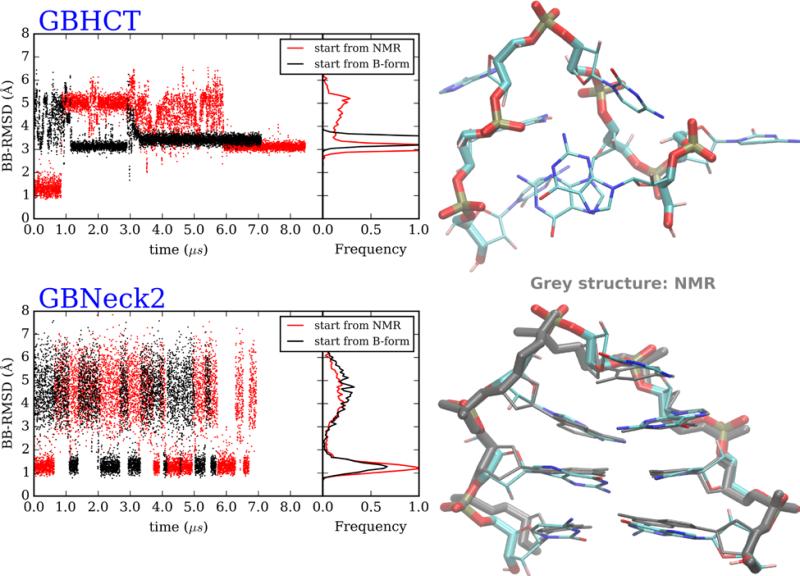
Figure 3.
DNA GCA hairpin loop MD simulations, starting from B-form and NMR structures. (Top left) Backbone RMSD versus time and RMSD histograms, from GB-HCT simulations starting from 2 conformations. (Bottom left) Backbone RMSD versus time and RMSD histograms, from GB-neck2 simulations starting from 2 conformations. Right: representative structures of most populated clusters from simulations starting from hairpin structures. (Top right) GB-HCT (misfolded). (Bottom right) GB-neck2 (folded, with NMR reference shown in grey). 2nd half of data was used for cluster analysis and histogram calculations.

