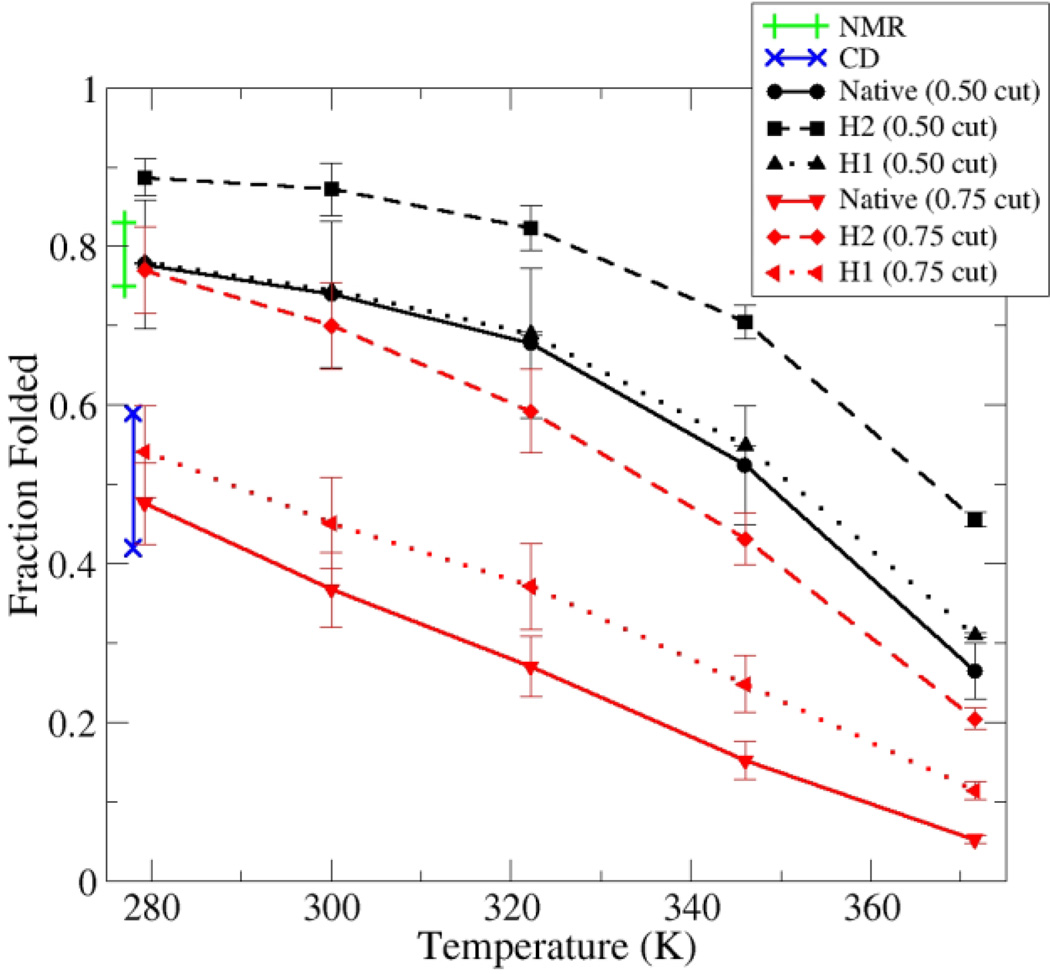
Figure 5.
Average melting curves for DPDP hairpin 1, hairpin 2, and overall ensemble from linear and collapsed REMD simulations. The data is quite sensitive to choice of cutoff. The black lines represent a less restrictive cutoff of 0.50, while the red lines represent a more restrictive cutoff of 0.75. Hairpin 1 structures were considered folded when QH1 was greater than the cutoff, hairpin 2 structures were considered folded when QH2 was greater than the cutoff, and fully formed β-sheet structures were considered formed when both cutoffs were satisfied. Using a more restrictive cutoff (0.75), the hairpin 2 melting curve intersects with NMR data (green line) and overall melting behavior intersects with CD data (blue line). Regardless of cutoff, hairpin 2 is more stable than hairpin 1 in each case. Error bars reflect differences between the linear and collapsed REMD data sets.

