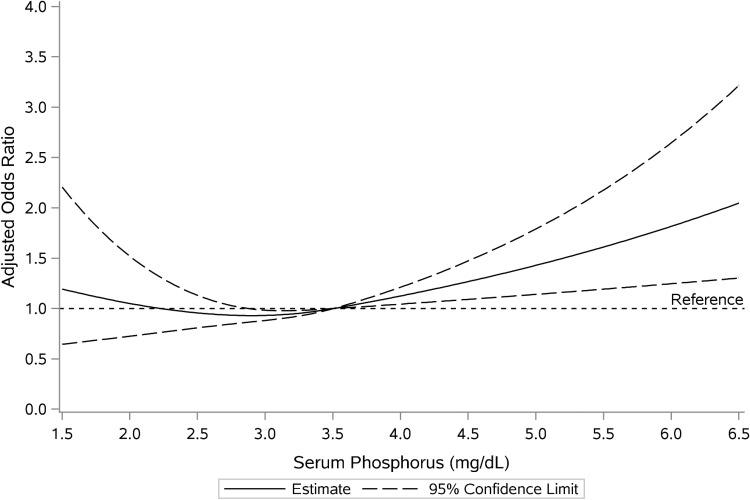
FIGURE 4:
Cubic spline plot of serum phosphorus and moderate anemia likelihood. OR was adjusted for age, sex, race, history of diabetes, renal function, serum albumin, ferritin and iron saturation. There was a significant likelihood of moderate anemia with phosphorus levels >3.5 mg/dL and a trend toward higher anemia likelihood with phosphorus levels <2.0 mg/dL.

