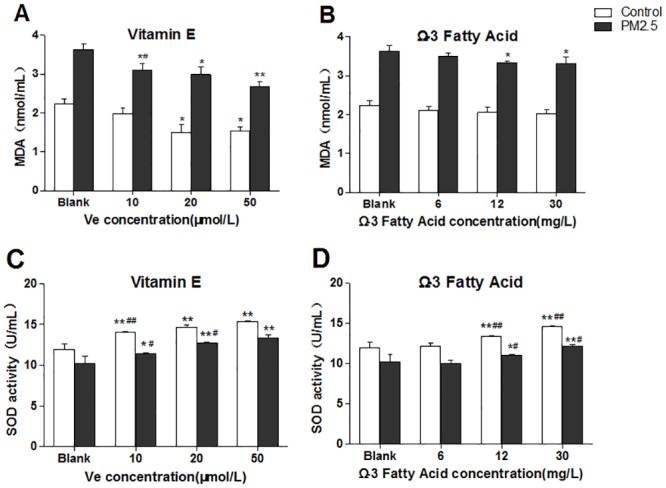
Fig 2. Oxidative stress in HUVECs after intervened by vitamin E (Ve) and Ω-3 fatty acids (Ω-3 FA) (n = 3 per group).

The blank group has no nutrients. The control groups have no PM2.5. A&B, representative MDA detection of supernatant; C&D, intracellular SOD activity. Significant difference **p< 0.01, *p< 0.05 vs. blank group; #p < 0.05, ##p < 0.05 vs. previous group in the bar graph.
