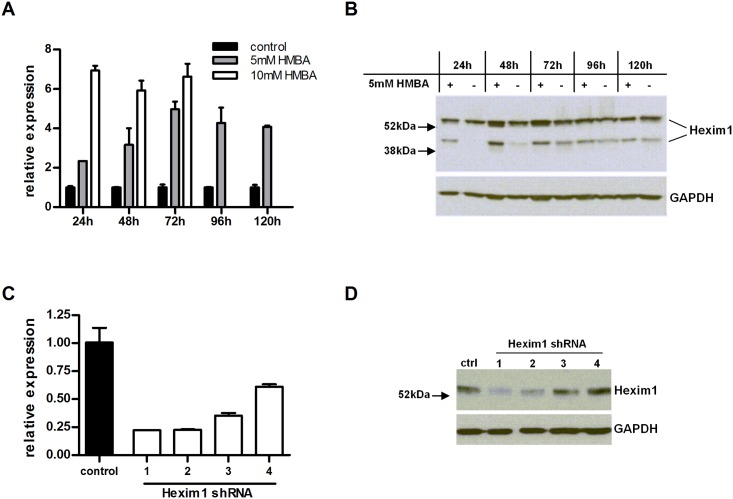
Fig 6. Confirmation of up- or downregulation of Hexim1.
Upregulation of Hexim1 was accomplished by stimulation of NIH 3T3 cells with HMBA, and the expression of Hexim1 was analyzed by quantitative PCR on mRNA level (A) and by Western Blot on protein level (B). In addition to the predicted 54 kDa band, a second band at approximately 40 kDa was detected by Western Blot with lysates from NIH 3T3 cells, probably representing a modified form of the protein. To downregulate Hexim1, stable cell lines of TCMK-1 cells expressing shRNA specific for Hexim1 were generated. Downregulation of Hexim1 in these cell lines was confirmed by quantitative PCR (C) and by Western Blot (D). The shRNAs 1 and 2 proved to be most effective regarding downregulation of Hexim1.

