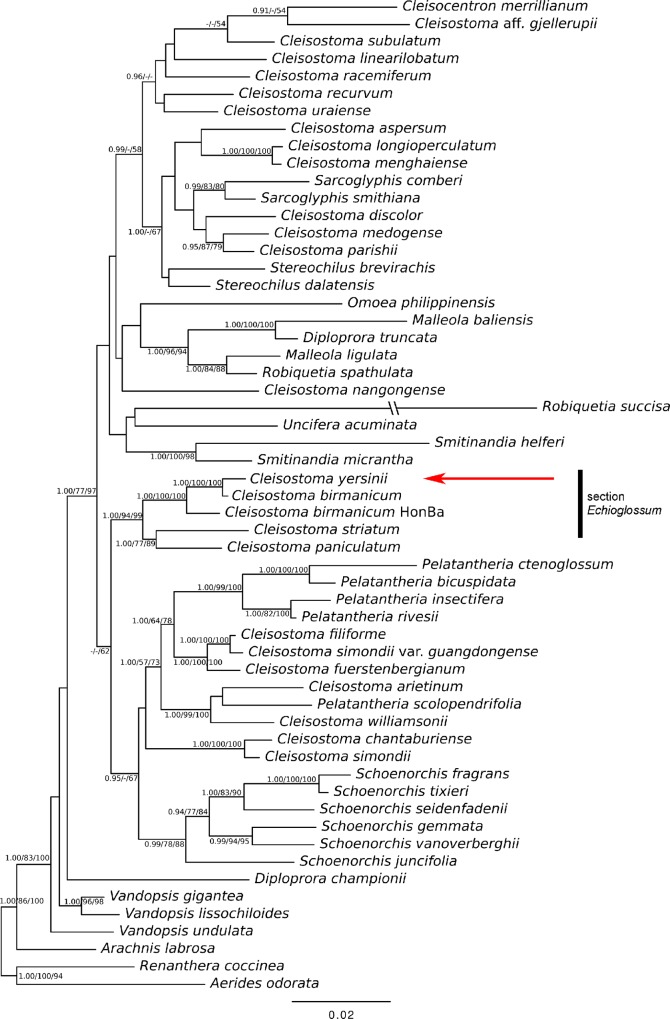
Fig 8. The Bayesian tree obtained from analysis of the combined dataset.
The numbers near the nodes are the Bayesian posterior probabilities (at the left) and the bootstrap percentages for Maximum parsimony (in the middle) and Maximum likelihood analysis (at the right). The posterior probabilities and bootstrap supports over 0.9 and 50, respectively, are shown. See S1 Table for GeneBank accession numbers.

