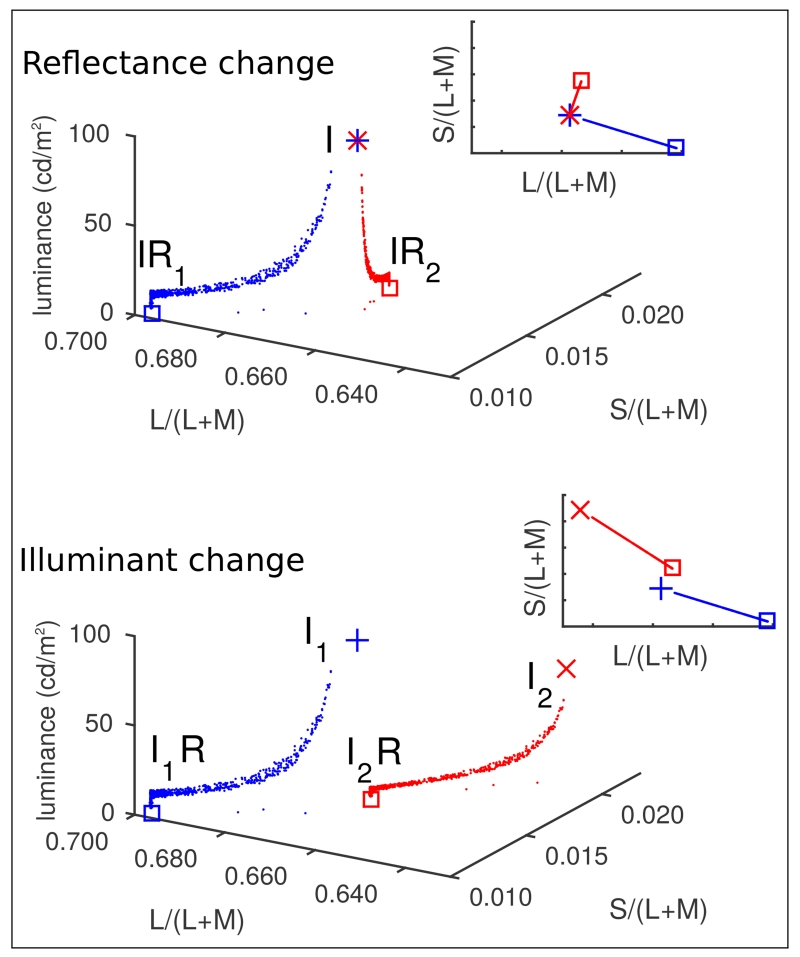
Fig. 1.
Chromaticitic distributions from stimulus images, plotted in the MacLeod-Boynton [17] chromaticity diagram (Constructed using the Stockman and Sharpe cone fundamentals [18, 19] with the S-cone fundamental scaled so that the maximum S/(L+M) value of the spectrum locus is 1 and the L- and M-cone fundamentals scaled so that they sum to V*(λ) [20]). These are taken from animations of spheres with high specularity. The blue dots show chromaticities from the first frame of the animation and the red dots show the chromaticities from the final frame. The top and bottom panels show the conditions to be descriminated in an operational constancy task: (top) a change in the spectral reflectance function of the sphere surface, with no change in the illuminant (I(λ)R1(λ) to I(λ)R2(λ)); and (bottom) a change in the spectral power distribution of the illuminant, with no change in the reflectance (I1(λ)R(λ)toI2(λ)R(λ)). The red and blue square symbols plot at the chromaticity of the product of the corresponding illuminant and reflectance functions (IR) projected onto the zero-luminance plane, and the + and × symbols plot at the chromaticity of the illuminant I. These I chromaticities have been plotted with reduced luminance since they were never directly viewed, and would be outside the range of the plot axes if plotted at their actual luminances. The 2D insets in each plot show the same chromaticity distributions projected onto an isoluminant plane.

