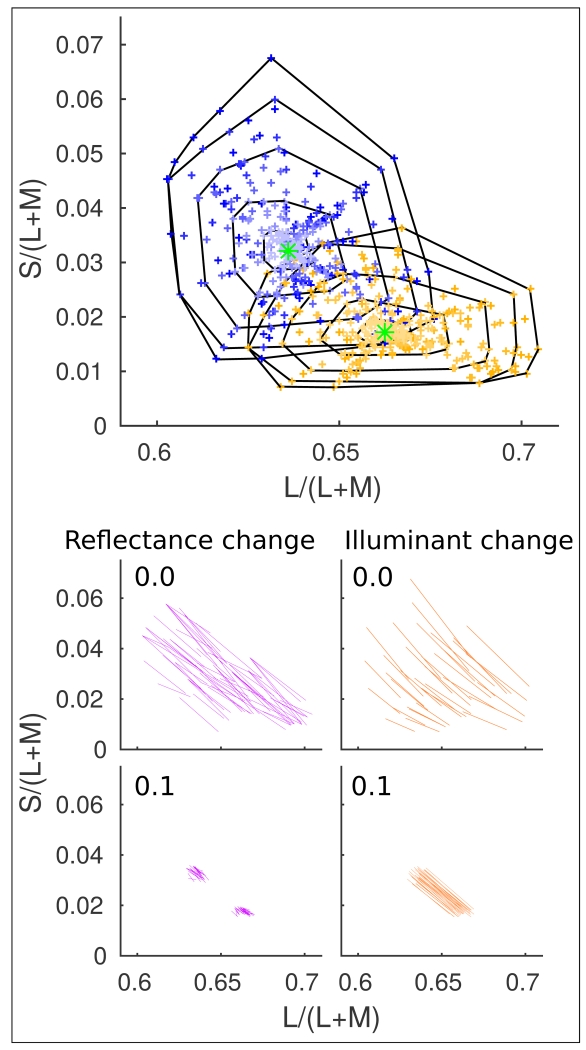
Fig. 5.
Top panel: Chromaticities of the brightest points in the first and final frames of our stimulus animations in the MacLeod-Boynton [17] chromaticity diagram. Yellow + symbols represent surfaces under sunlight, and blue + symbols represent surfaces under skylight. Points with lower saturaton indicate chromaticites with higher specularity. Each of the black polygons encloses chromaticities from stimuli with a particular specularity. The outermost polygon contains surfaces with zero specularity and the smaller polygons enclose stimuli with higher specularities. The chromaticities of the illuminants themselves are indicated by the green symbols in the centres of the corresponding clusters. Lower four panels: Chromaticities visited by the brightest points in our stimulus animations with zero specularity (upper small panels), and specularity = 0.1 (lower small panels) in the same color space as the top panel. Each line connects the chromaticity from the first frame to that of the final frame in one animation. Purple lines (left panels) represent reflectance changes and orange lines (right panels) represent illuminant changes.

