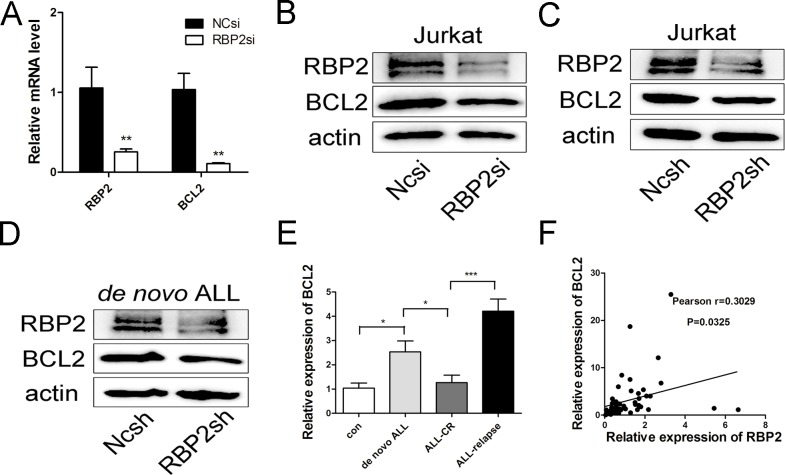
Fig 3. Effect of RBP2 on BCL2 expression.
(A) qRT-PCR analysis of RBP2 and BCL2 mRNA levels after transfection with RBP2-siRNA in Jurkat cells for 72h. Data are presented as the mean± SEM. **P< 0.01 by Student’s t-test. (B, C) Western blotting analysis of RBP2 and BCL2 protein levels after transfection with RBP2-siRNA and RBP2-shRNA in Jurkat cells. (D) Western blotting analysis of RBP2 and BCL2 protein levels after transfection with lenti-RBP2-shRNA virus in ALL primary cells for 72h. The primary cells were from the bone marrow of ALL patients. (E) BCL2 mRNA levels in ALL samples. Mann-Whitney U-test was used to calculate the P value;*P< 0.05, ***P< 0.01. (F) The correlation between RBP2 and BCL2 in ALL samples (Pearson r = 0.3029, n = 50); *P< 0.05, ***P< 0.001.

