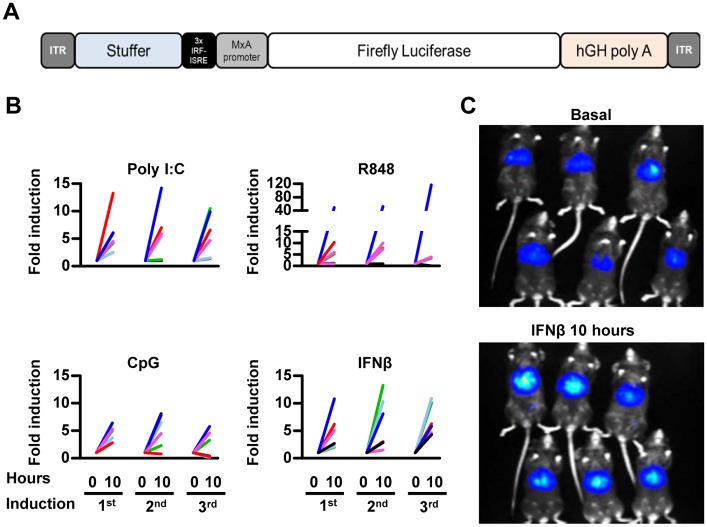
Fig 3. In vivo activity of AAV8-3xIRF-ISRE-Luc in response to IFN-agonist.
A) Schematic representation of the AAV8-3xIRF-ISRE-Luc vector (not drawn to scale). B) Mice were inoculated iv with 3x10¹⁰ vg of the vector. Two weeks later, animals were divided in different groups and received the following iv stimuli: poly I:C, CpG DNA, Imiquimod (R848) or murine IFN-β. Treatments were repeated weekly for 3 weeks. Luciferase activity was quantified by BLI. Each line represents the fold luciferase activity of each individual mouse. C) Representative BLI images of AAV8-3xIRF-ISRE-Luciferase transduced mice before and 10 hours after murine IFN-β administration. These data are from one experiment representative of two.

