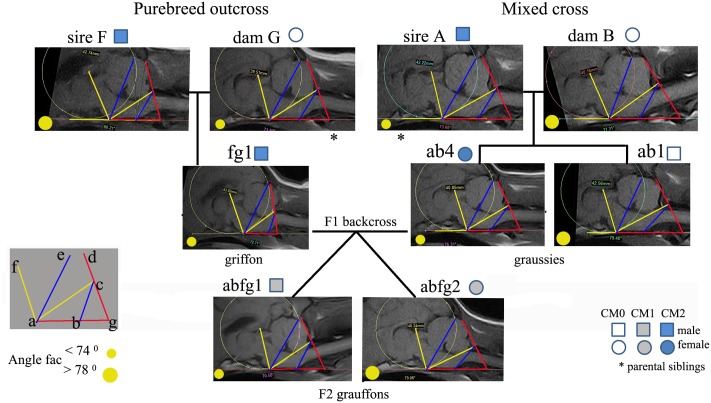
Fig 4. Key morphometric measurements made on the MRIs of dogs in three generation pedigree of the F2 Backcross.
The CM0 F1 hybrid ab1 provides an additional control comparison. The lines and angles have been linked together providing a visual representation of the interrelationships between the individual traits. Sire fg1 and son abfg1 have similar values for angle FAC(~70°) but different values for line bc. Similarly, dam ab4 and daughter abfg2 have similar trait values for line bc (~15.7) but different values for angle FAC.

