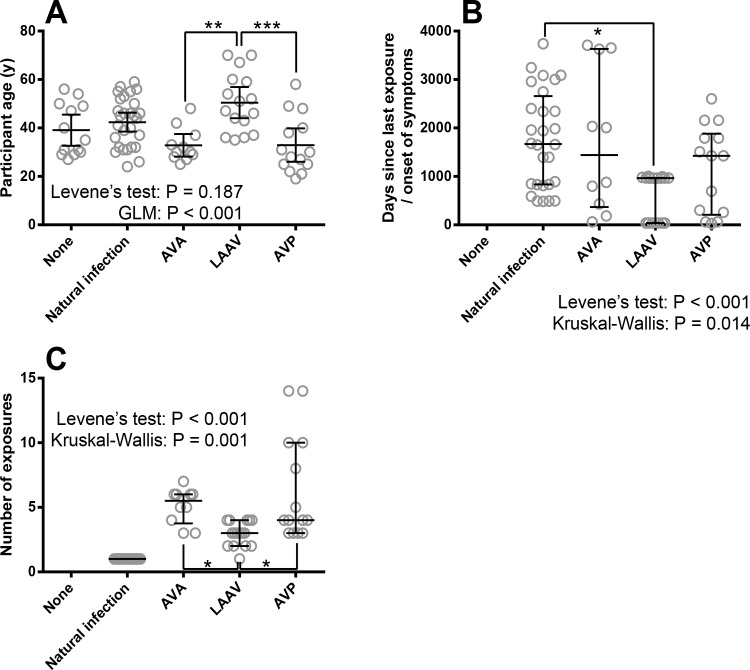
Fig 1. The characteristics of individuals enrolled into this study including: age, number of exposures to B. anthracis antigens and time since exposure in relation to the type of exposure to B. anthracis antigens.
Panel A shows the distribution of age across groups in study including individuals with no history of Anthrax, recent Anthrax infection, or one of three different vaccines. Each symbol denotes a single participant, the line is the mean and the error bars 95% Confidence Intervals. Statistical analysis is shown where Levene’s test validated GLM has been performed with Bonferroni’s post-tests. Panel B shows the distribution of time since exposure to vaccine or onset of anthrax symptoms across groups in the study. Each symbol denotes a single participant, the line is the median and the error bars the quartile range. The data were analysed by Kruskal-Wallis test (excluding naïve controls), which indicated differences between groups with Dunn’s individual comparisons. Panel C shows the distribution of number of anthrax-based immunological stimuli (doses) across groups in the study including percent people who had had Anthrax infection, or one of three different vaccines. Each symbol denotes a single participant, the line is the median and the error bars the quartile range. The data (excluding naïve and naturally infected controls) were analysed by Kruskal-Wallis test, which indicated differences between groups with Dunn’s individual comparisons. Significance markers indicate either P-values associated with either Bonferroni’s (For GLM) or Dunn’s (for Kruskal-Wallis) multiple comparisons where * indicates P < 0.05, ** indicates P < 0.01 and *** indicates P < 0.001).

