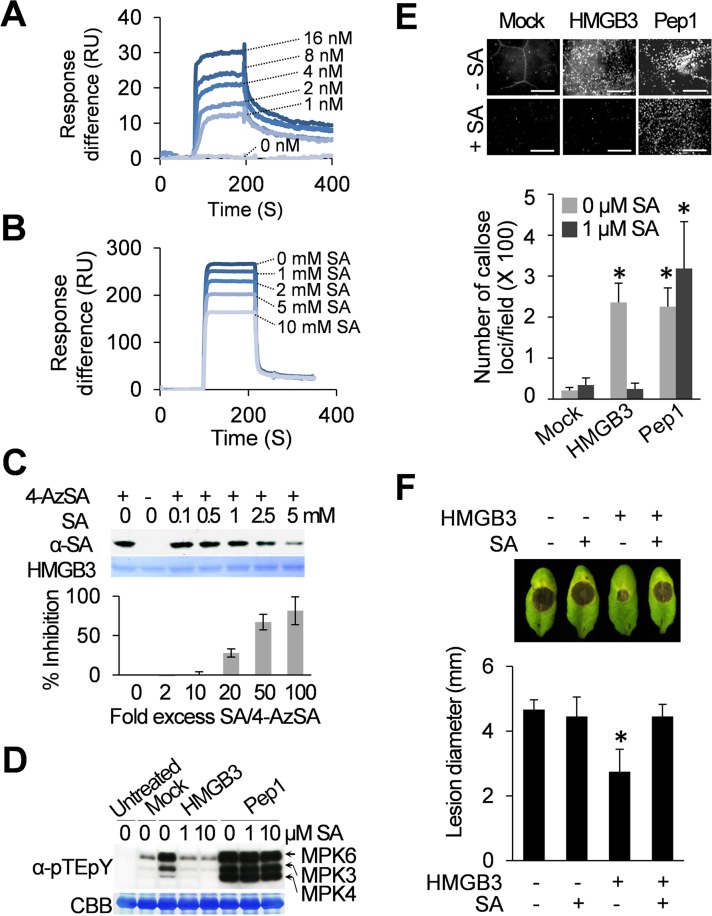
Fig 5. SA binds to HMGB3 and inhibits its DAMP activity.
A-B. SPR analysis of HMGB3’s SA-binding activity. A. Sensorgrams obtained with different concentrations of HMGB3 using a 3AESA-immobilized sensor chip. B. Sensorgrams obtained with 1 μM HMGB3 in the presence of indicated concentrations of SA using a 3AESA-immobilized chip. The signals detected from a mock-coupled control chip were subtracted. C. Photoaffinity labeling of HMGB3 using 4-AzSA. HMGB3 was incubated with 50 μM 4-AzSA in the presence of different concentrations of SA, and then exposed to UV light (30 mJ). HMGB3 labeled with 4-AzSA was detected by IB analysis with α-SA antibodies. HMGB3 stained with CBB served as a loading control. The results are expressed as a percentage of inhibition in the presence of the indicated fold excess of SA as compared to the amount 4-AzSA crosslinked HMGB3 formed in the absence of SA, which was assigned 0% inhibition. Data are the mean ± SD (n = 2). D. SA inhibited HMGB3-induced, but not Pep1-induced, MAPK activation. Leaves were collected 15 min after infiltration with water (mock) or with water containing either 1 μM HMGB3 or Pep1 in the presence of the indicated concentrations of SA. Leaves not infiltrated served as an untreated control. Phosphorylated, and thus activated, of MPK3, MPK4, and MPK6 were detected with α-pTEpY antibody. Rubisco large subunit protein stained with CBB served as a loading control. E. SA inhibited HMGB3’s, but not Pep1’s, ability to induce callose deposition. Leaves were stained with aniline blue 15 h after infiltration with water containing 0.1 μM HMGB3 or Pep1 in the presence or absence of 1 μM SA. Representative pictures are shown in upper panel. Bars = 100 μm. Data are the mean ± SD (lower panel, n = 20). F. SA inhibited enhanced resistance to B. cinerea induced by HMGB3. Leaves were infiltrated with water containing 100 nM HMGB3 with or without 1 μM SA one day before B. cinerea infection. Representative disease symptoms at 3 dpi are shown in the upper panel. Data corresponding to this time point are presented as the mean ± SD (lower panel, n = 6). Asterisks indicate a significant difference from the mock-treated leaves (t test, P < 0.05). Leaves infiltrated with water served as controls in experiments D-F.

