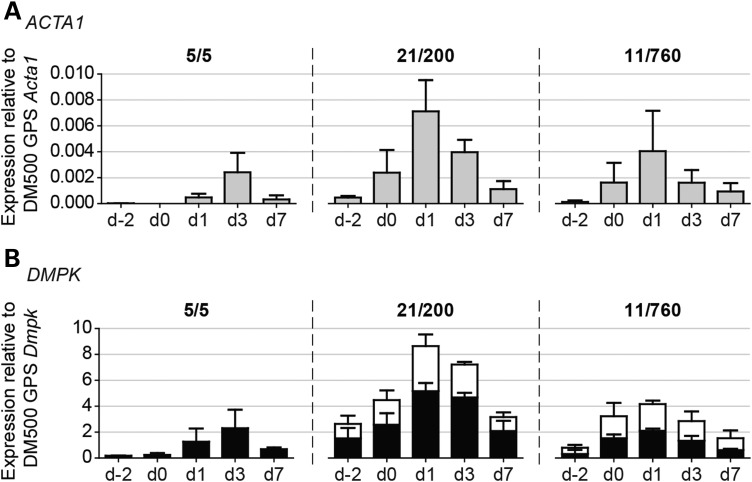
Figure 4.
Expression profile of proliferating and differentiating primary human DM1 myogenic cells. Assessment of ACTA1 (A) and DMPK (B) transcript levels by northern blot analysis. Signal strength in each sample was normalized to that of 18S rRNA, as outlined in the legend of Figure 2. To facilitate direct comparison with DM1 mouse model-derived myoblasts, ratios were related to Acta1 and Dmpk levels in DM500 GPS muscle. Data were obtained from two independent culture series per cell line, for which triplicate cultures per series were pooled and analyzed; bars represent mean + SEM. Stacked bar graphs show levels of normal-sized DMPK (black part) and expanded DMPK (white part) in patient-derived cultures. On average, the ratio expanded versus normal-sized DMPK transcripts was 0.63 for 21/200 and 0.84 for 11/760. Timing of differentiation on the x-axis refers to Figure 3.

