Figure 6.
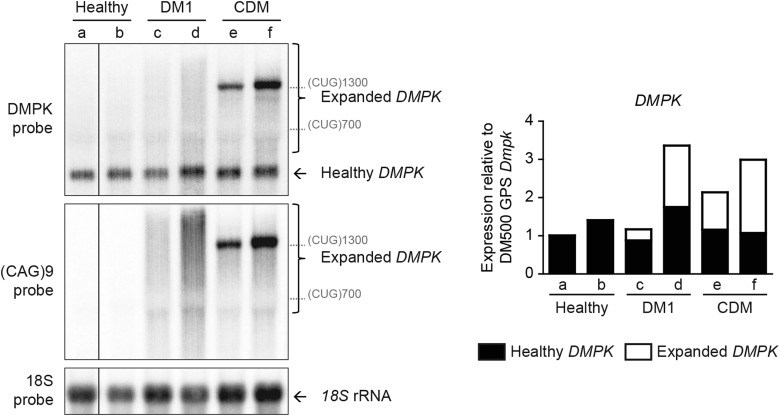
DMPK expression in human control and DM1 patient tissue. Northern blot (left) of human control and DM1 muscle tissue using a DMPK and a (CAG)9 repeat probe. Healthy DMPK mRNA appeared as a defined band in all tissues. Expanded DMPK mRNA appeared as a defined band in congenital DM1 tissue (CDM-e and -f), but as a smear (representing somatic mosaicism of repeat size) in adult DM1 tissue (DM1-c and -d). As size markers, we indicated the location of DMPK (CUG)700 and (CUG)1300 transcripts. DMPK transcript levels, normalized to those of 18S rRNA, were plotted relative to Dmpk transcript levels in DM500 GPS muscle to allow for comparison with DM1 mouse models (right). Stacked bar graphs show levels of normal-sized DMPK (black part) and expanded DMPK (white part) in patient-derived samples. The ratio expanded versus normal-sized DMPK transcripts was 0.33 in DM1-c; 0.92 in DM1-d; 0.84 in CDM-e and 1.79 in CDM-f.

