Figure 7.
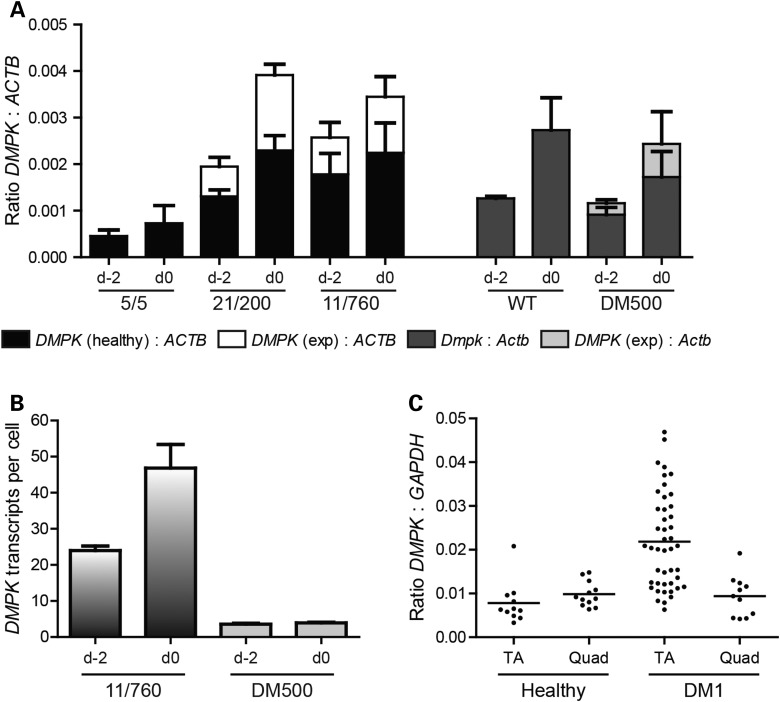
DMPK RNA copy number in human and mouse myoblasts. The absolute number of DMPK transcripts per cell was calculated based on experimental data from northern blotting (A), RT-qPCR (B) and RNA-sequencing (C). (A) Stacked bar graph showing DMPK/Dmpk:ACTB/Actb transcript ratios determined from signal strengths on northern blots for human myoblast lines 5/5, 21/200 and 11/760, and mouse myoblasts lines WT and DM500 (Supplementary Material, Fig. S4B). (B) DMPK transcript copy number in 11/760 and DM500 myoblasts was determined on the basis of known amounts of synthetic DMPK RNA fragments in RT-qPCR (Supplementary Material, Fig. S5). Note that, normal-sized and expanded DMPK transcripts could not be measured independently. (C) DMPK:GAPDH ratio based on RNA-sequencing signal of healthy and DM1 TA and quadriceps (Quad) tissue (www.dmseq.org). Each data point represents a single tissue. Mean + SEM (A and B), or mean only (C) are shown. Descriptions d-2 and d0 refer 938 to Figures 1 and 3.

