
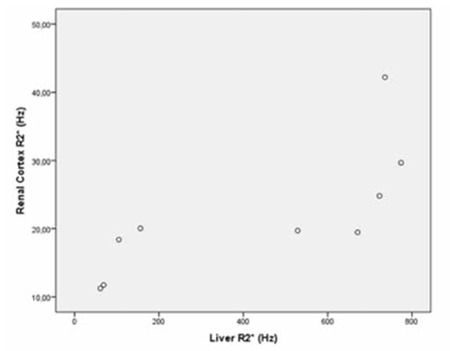
Figure 5. Scatterplot shows the correlation between liver R2* and renal cortex R2* (p=0.020, r=0.750).
Official websites use .gov
A
.gov website belongs to an official
government organization in the United States.
Secure .gov websites use HTTPS
A lock (
) or https:// means you've safely
connected to the .gov website. Share sensitive
information only on official, secure websites.