
Fig. 7.
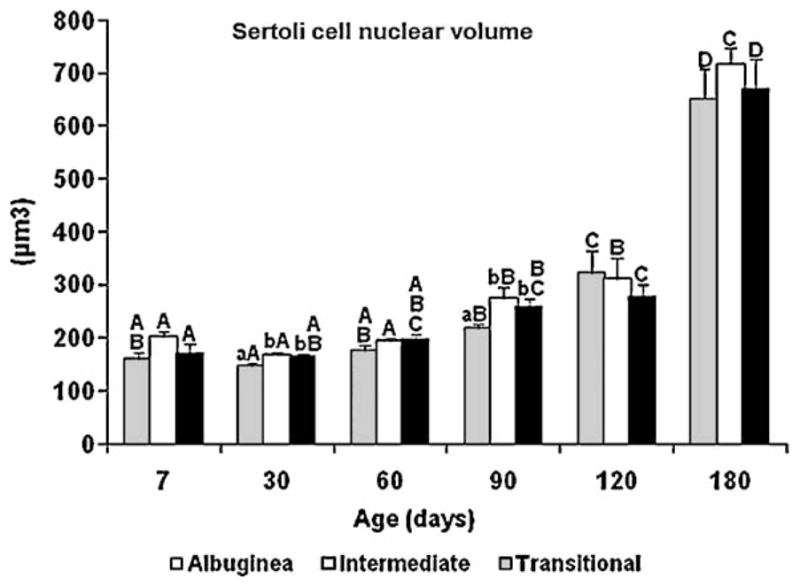
Sertoli cell nuclear volume (mean ± SEM) in three regions of the testicular parenchyma during postnatal development in pigs. Different lowercase letters denote significant differences between regions, whereas different uppercase letters denote significant differences between ages for the same region (P < 0.05).