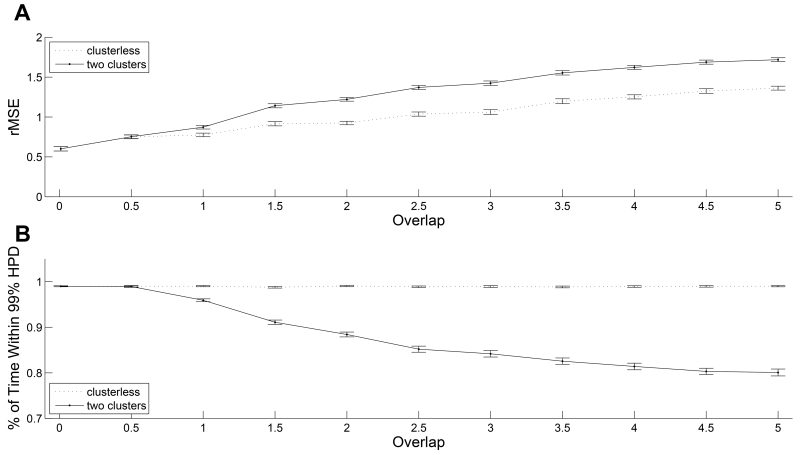
FIGURE 3.
Quality of fit comparison between the two decoding algorithms. (A) Root-mean-squared error (rMSE) between the true positions of the animal and their estimated values averaged across 100 trials as a function of the overlap between mark spaces of two simulated neurons. Error bars represent 2 standard deviations from the mean rMSE. The dotted line represents the performance of clusterless decoding method. The solid line represents the performance of decoding with spike-sorting method. (B) Fraction of time that the true position values were covered by the 99% highest posterior density (HPD) region averaged across 100 trials as a function of the overlap between mark spaces of two simulated neurons. Error bars represent 2 standard deviations from the mean coverage probability. The dotted line represents the performance of clusterless decoding method. The solid line represents the performance of decoding with spike-sorting method.

