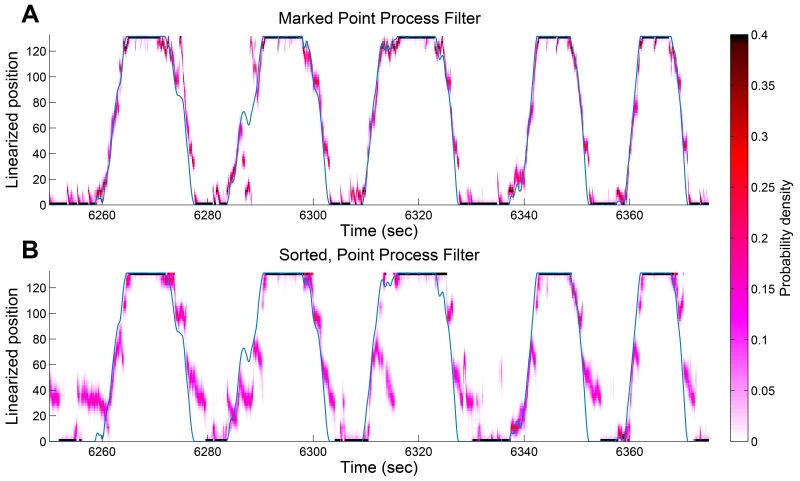
FIGURE 4.
Decoding results for hippocampus data. (A) Posterior density of the rat’s linear position using the clusterless decoding algorithm. The blue line represents the actual position of the rat. The red represents the posterior density at each time step. The posterior density computed through the clusterless decoding algorithm has an rMSE of 14.3 cm and remains within the 99% HPD region 74.25% of the time. (B) Posterior density of the rat’s linear position using decoding with manual spike-sorting. The posterior density computed by first spike-sorting and then decoding has a rMSE of 26.0 cm and remains within the 99% HPD region 70.76% of the time.

