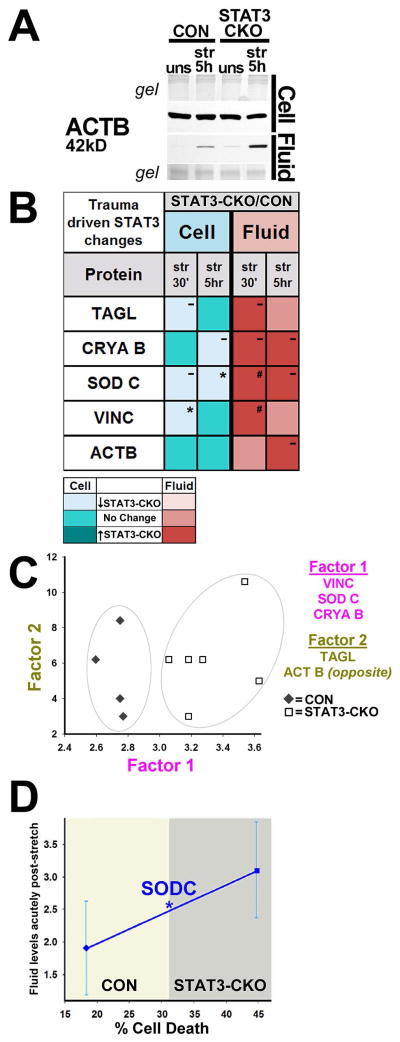
Figure 6. Elevated fluid proteins capture STAT3 deficient cell death increase.
A, Immunoblot shows increased fluid levels of ACTB in STAT3-CKO versus CON by 5 h post-injury while cellular levels were similar. B, Mean cell (turquoise) and fluid (red) injury-induced protein changes between STAT3-CKO and CON astrocytes for 5 astrocytic proteins with same base expression in both genotypes (WCL n=3–5, CM n=2–5 animals per genotype and timepoint). STAT3-CKO had higher release than CON cultures at one or both timepoints post-injury (darker red boxes, # p=0.09 for SODC, # p=0.08 for VINC, both 30 min post-injury). STAT3-CKO had larger trauma-induced cellular losses versus CON astrocytes for TAGL, CRYAB, SODC and VINC (lighter turquoise; *p<0.05 for SODC at 5 h and for VINC at 30 min post-injury). C, Plotted are weighted mean fluid protein amounts at 30 min post-injury using Factor 1 (covariation of VINC, SODC and CRYAB) over Factor 2 (covariation between TAGL and ACTB) in stretched cultures of 4 CON and 6 STAT3-CKO animals. CON (◆) and STAT3-CKO (□) data are separated based on Factor 1 expressing a trauma response difference between genotypes (gray ellipses). D, Plotted is mean acute stretch-release of SODC (fluid change 30 min and 5 h after stretching) over percent delayed cell death (PI dye uptake at 48 h) in CON (◇) and STAT3-CKO (□) cultures (n=11 each genotype, * P=0.04, Mann-Whitney).

