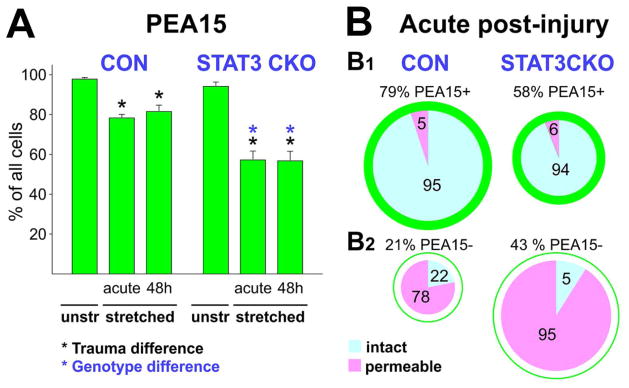
Figure 8. PEA15 depletion associates with astrocyte permeability after injury.
A, Plotted are means and SEM of percent CON and STAT3-CKO astrocytes with PEA15 signals in unstretched and acutely stretched cultures (5 and 30 min post-injury combined) as well as 48 h post-injury. Black asterisks indicate significant loss of cells with PEA15 staining in stretched versus unstretched cultures (P<0.05). Genotype difference (blue asterisks) shows smaller PEA15-positive cell population in STAT3-CKO versus CON stretched cultures (P<0.001; post-hoc multiple comparison ANOVA Tukey, Table 4). B, Pie charts are sized to reflect proportions of PEA15-positive (B1) and PEA15–negative (B2) populations of all cells in both genotypes. Pies show fractions of permeable cells (PI-positive nuclei, pink) and non-permeable, intact cells (PI-negative nuclei, blue) acutely after stretching for both genotypes. The majority of PEA15-retaining cells were intact (B1) while PEA15 loss (B2) was strongly associated with cell permeability (P<0.001, Tukey-Kramer).

