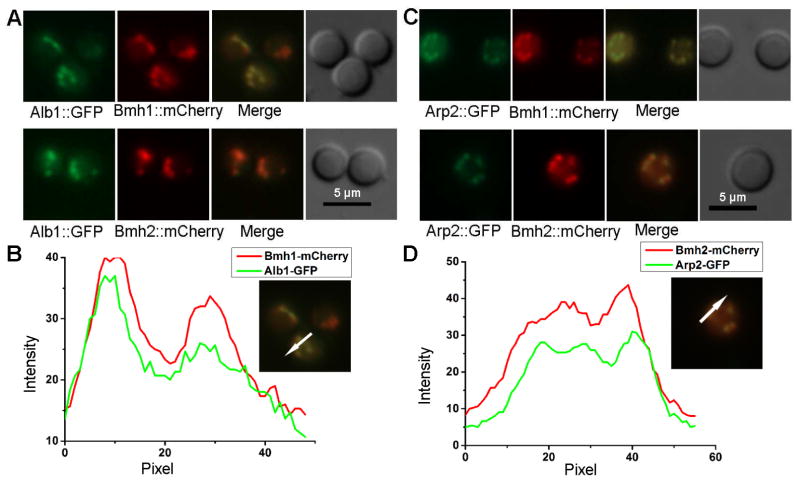
Figure 3. Co-localization of two 14-3-3 isoforms, Bmh1 and Bmh2, with melanin enzymes Alb1 and Arp2.
(A) Images of Alb1-GFP with either Bmh1-mCherry (top) or Bmh2-mCherry (bottom) in conidia.
(B) The fluorescence intensity profiles of Alb1-GFP and Bmh1-mCherry plotted against the conidial cellular axis in the direction shown in the images at right.
(C) Images of Arp2-GFP with either Bmh1-mCherry (top) or Bhm2-mCherry (bottom) in conidia.
(D) The fluorescence intensity profiles of Arp2-GFP and Bmh2-mCherry plotted against the conidial cellular axis in the direction shown in the images at right.

