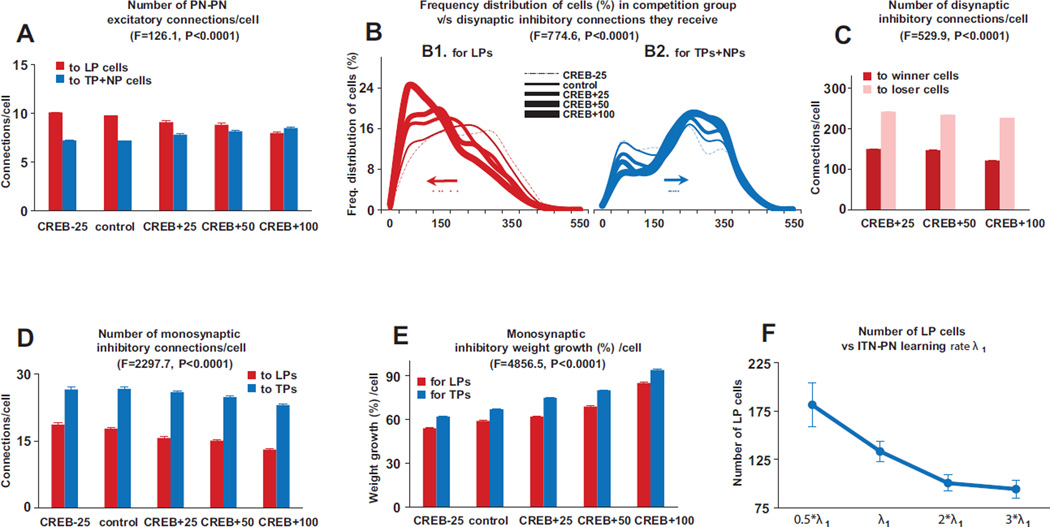
Figure 3.
Mechanisms that implement competition. The numbers in panels 2A and 2C were normalized to the control group case as follows: first the number of connections received by a cell was divided by the group size for the particular CREB case and then multiplied by the group size for the control case. A. Within the competition group, LPs received significantly more monosynaptic excitatory inputs from other PNs than TP and NP cells for all the cases except the CREB+100% condition (two way ANOVAs, F=126.1, DF=1, p<0.0001). B. Frequency distribution of disynaptic inhibitory connections received by cells in the competition group for LPs (B1) and TPs+NPs (B2). The numbers have been normalized for the CREB cases by dividing by group size and then multiplying by the size of the control group. Dots represents the mean values of the disynaptic inhibitory connections for the various CREB cases, and the arrows points to the direction the mean moves with increasing CREB %s. LPs in the competition group received markedly less disynaptic inhibition from other competing PNs than TP and NP cells for all the cases (two way ANOVAs, F=774.6, DF=1, p<0.0001).C. The number of disynaptic inhibitory inputs from other PNs onto loser LPs, compared to those onto winner LPs, was significantly higher (two way ANOVAs, F=529.9, DF=1, p<0.0001). D. Compared to LP cells, TP cells received considerably higher monosynaptic connections from ITNs across all CREB cases (Fig 2D; two way ANOVAs, F=2297.7, DF=1, p<0.0001). E. Compared to LP cells, TP cells exhibited significantly higher growth in ITN-PN connections (Fig 2E; two way ANOVAs, F=4856.5, DF=1, p<0.0001). F. Variation of LP cell numbers with changes in learning rate λ1 for the ITN-PN connections. Data represent average ± SEM across five different network instantiations of probabilistic connectivity gradients for all panels except F which is over all the CREB cases.

