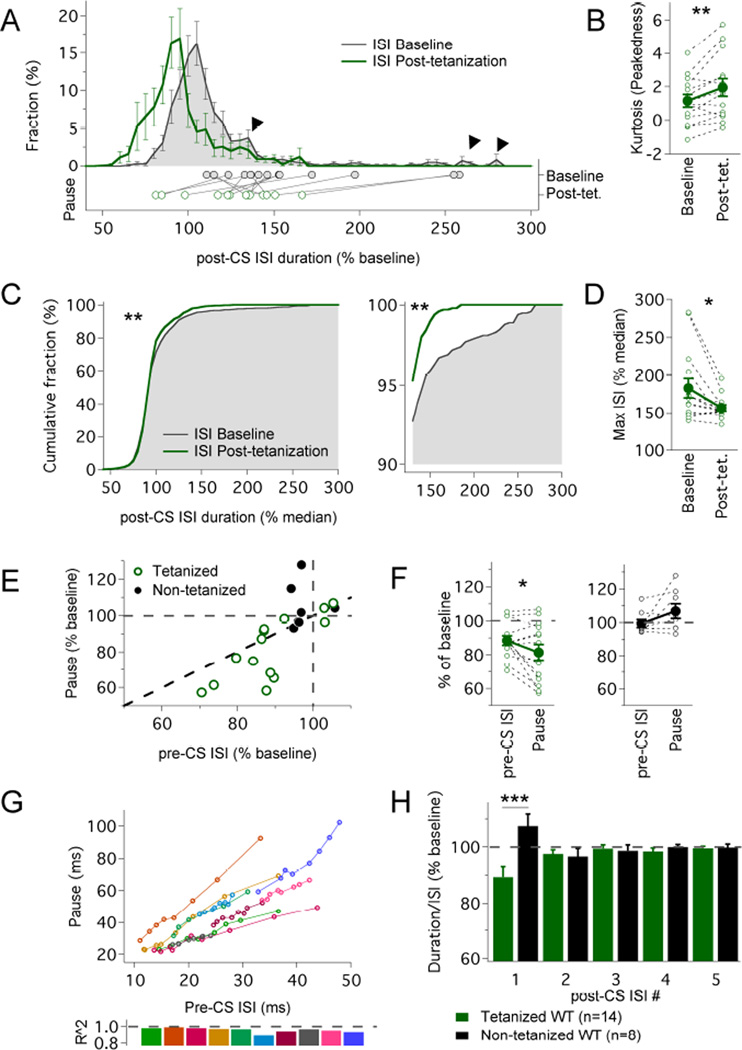
Figure 3. Intrinsic plasticity has a larger effect on the pause than on general excitability.
(A) Average distribution of ISI values following the complex spike (post-CS) before (black line; shaded grey) and after (green line) application of the IP protocol. The ISI duration is normalized to pre-complex spike (pre-CS) ISI values monitored before tetanization. Arrowheads outline tails of the distribution affected by the IP protocol. The dots below indicate the averaged pause duration for each cell before (filled dots) and after tetanization (empty dots). (B) Kurtosis values of post-CS ISI values from each cell and their group average before and after tetanization (n=14; **p=0.009, Wilcoxon sign-ranked test). (C) Cumulative distribution of pooled post-CS ISI values before (black line; shaded grey) and after (green line) application of the IP protocol. The ISI values were rescaled (compared to the distribution in A) by normalization in each individual cell to median pre-CS ISI values, and monitored before (n=1095 ISIs) and after tetanization (n=1081 ISIs) to assess changes in the tails. (D) Maximal ISIs obtained from each individual cell, normalized as in (C) (n=14; *p=0.011; Wilcoxon sign-ranked test). (E) Changes in pause duration plotted against changes in pre-CS ISI values for tetanized (green; n=14) and non-tetanized cells (black; n=8); the grey dashed lines indicate a null variation after the protocol, the black dashed line indicates equal variation in ISI and pause. (F) Comparison between the variation in the median pre-CS ISI and the variation in the pause in tetanized (left) and control cells (right; n=14; *p=0.040, paired t-test). (G) Pause duration plotted against pre-CS ISI duration at increasing amplitude of injected current (n=10 cells); each line represents an individual cell; 5–9 steps (single measurement) per cell. (H) Intrinsic plasticity shortens the duration of the pause, but not the duration of subsequent ISIs (normalized values). Duration of the ISIs following the complex spike (pause = ISI #1) expressed as % of baseline after normalization to the average ISI (calculated from the eight ISIs preceding the complex spike). Only the pause was significantly shortened in tetanized cells (n=14; compared to control cells, n=8; repeated measure ANOVA; group effect p=0.0121, ISI effect p=0.829, ISI×group interaction p=0.00030; **Tukey’s post-hoc comparisons: p=0.000326, pause in tetanized vs non-tetanized cells). The data shown in (A–F) and (H) were obtained from the same recordings that are shown in Fig. 2B. Values are shown as mean ± SEM. *p<0.05; **p<0.01.

