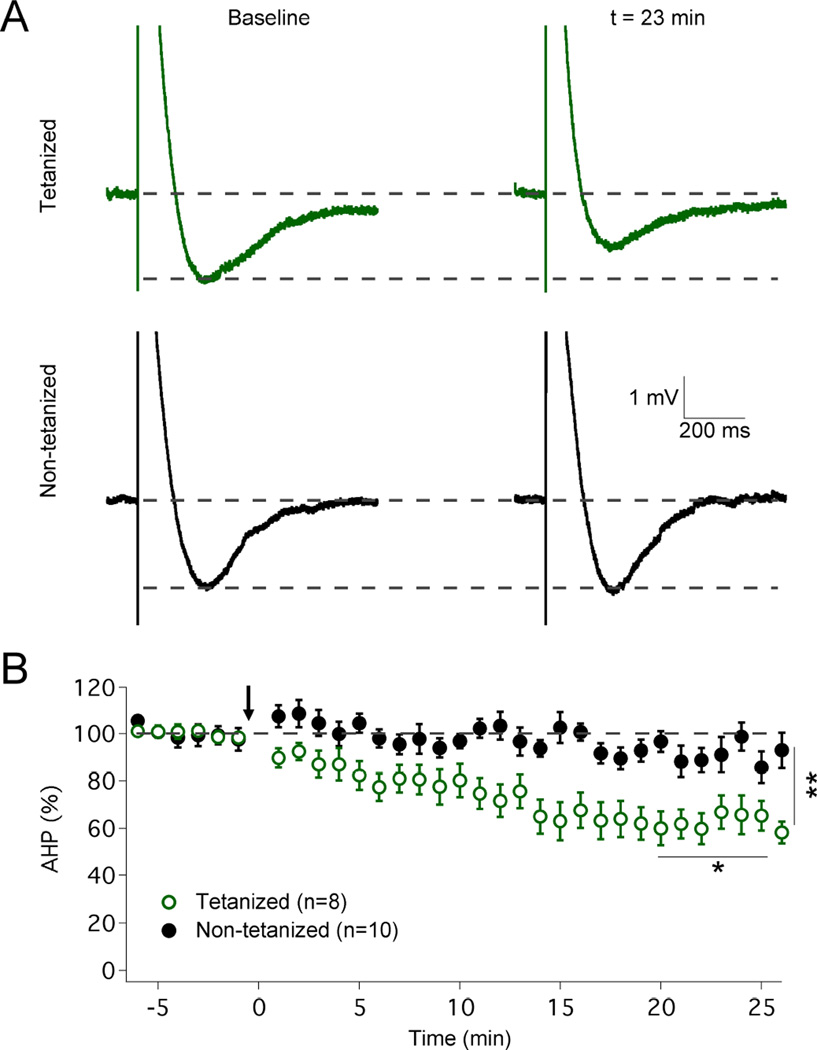
Figure 4. Intrinsic plasticity reduces the amplitude of the complex spike AHP.
(A) Typical traces showing complex spike AHPs before and after tetanization. The AHP amplitude is reduced in tetanized cells (top) but not in control cells (bottom). (B) Time graph showing that the IP protocol reduces the AHP amplitude (n=8), which remains unaltered in control cells (n=10). The arrow indicates the time point of tetanization. Values are shown as mean ± SEM. *p<0.05; **p<0.01.

