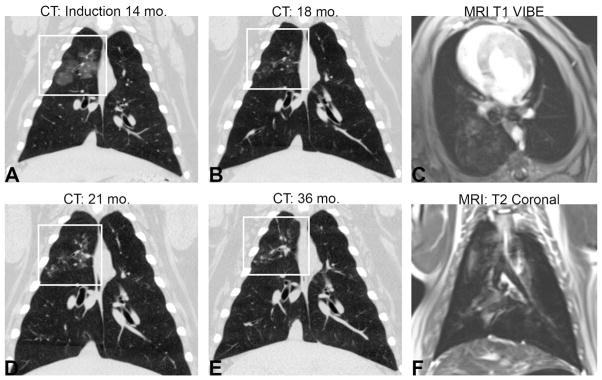
Figure 1. Longitudinal development of disease and lung images.
The progression of disease, highlighted by the white box, in subject 4 from (A) deposition of silica at 14 months and disease progression at (B) 16 months, (C) 21 months, and (D) 36 months of age. Example MRI images from subject 3 at 18 months (E) post-contrast T1-weighted scan VIBE and (F) turbo spin echo T2-weighted scan.

