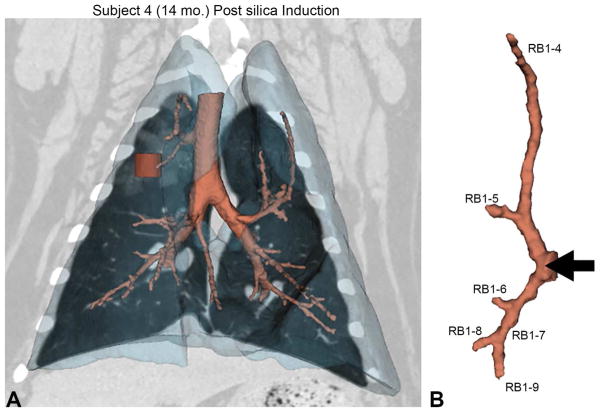
Figure 2. Silica deposition and corresponding quantitative measures.
(A) Volumetric rendering of the lungs (translucent blue) with the corresponding airway tree (peach) from subject 4. The red cylinder within the upper lung indicates the location of the volumetric region of interest (ROI) used for CT attenuation analysis. The corresponding CT coronal-section shows the deposition of silica as noted by the increased attenuation in the surrounding area. (B) The apical bronchus airway tree and the labeling system used to identify each branch. The black arrow shows the site of silica deposition with the bronchoscope corresponding to the black arrow in A. (C) Percent change from baseline (at 12 months of age) of lung attenuation (measured in Hounsfield Units) in the ROI for exposure and control animals. Due to the nature of CT in the lungs (negative Hounsfield Unit values), an increase in attenuation results in a negative percent change. (D) Change in wall area fraction in the peripheral airways of the apical bronchus tree. Change is determined as the difference between wall area fraction measures at 15 months post exposure (27 months of age) versus those acquired at baseline (12 months of age).


