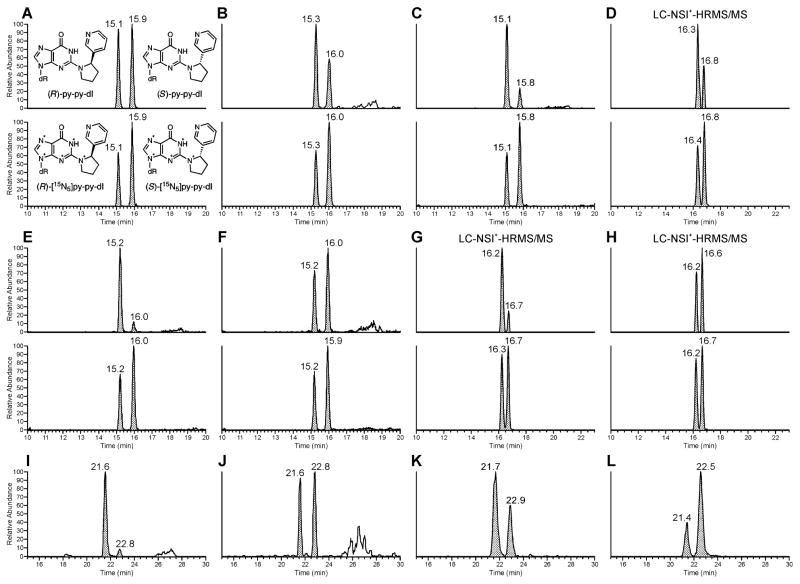
Figure 2.
LC-MS/MS traces obtained upon analysis of py-py-dI in hydrolysates of DNA from experiments carried out in vitro and in vivo. In all sections, the top chromatogram is the mass transition for (R)-py-py-dI (eluting first), and (S)-py-py-dI (eluting second). The bottom chromatogram in each section is the mass transition for the [15N5]-labeled internal standards, which were not available at the time samples (I–L) were analyzed. Asterisks denote 15N isotopes. Chromatograms are from the following sources (treatment): (A) Analytical standards in H2O (5 fmol/uL), (B) Rat liver (100 ppm racemic NNN), (C) Rat olfactory mucosa (50 ppm racemic NNN), (D) Human liver S9 (5 μM racemic NNN), (E) Rat hepatocytes (50 μM (2′S)-5′-acetoxyNNN), (F) Rat hepatocytes (50 μM (2′R)-5′-acetoxyNNN), (G) Human liver S9 (5 μM (S)-NNN), (H) Human liver S9 (5 μM (R)-NNN), (I) Rat respiratory mucosa (28 ppm (S)-NNN), (J) Rat respiratory mucosa (28 ppm (R)-NNN), (K) Calf thymus DNA exposed to (2′S)-5′-acetoxyNNN in buffer. (L) Calf thymus DNA exposed to (2′R)-5′-acetoxyNNN in buffer. All traces except (D), (G), and (H) were from the triple quadrupole LC-ESI+-MS/MS method.

