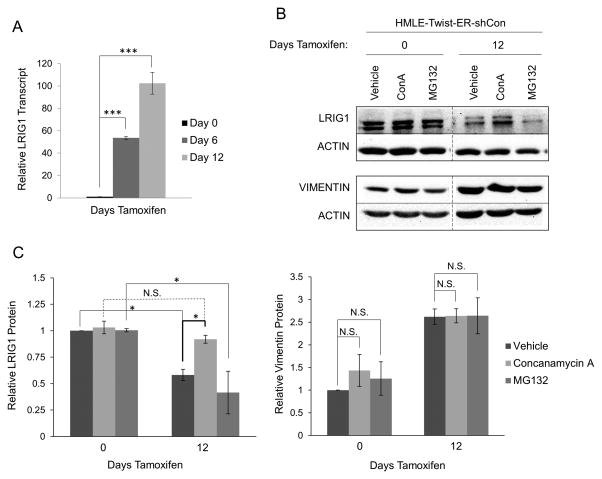
Figure 4. LRIG1 protein expression is increased by lysosomal inhibition in HMLE-Twist-ER cells.
(A) LRIG1 transcript expression was measured by quantitative real time PCR in HMLE-Twist-ER-shCon cells at Day 0, Day 6 or Day 12 post-Twist induction. (B) HMLE-Twist-ER-shCon cells at Day 0 or Day 12 post-Twist induction were treated with DMSO (Vehicle), 100 nM Concanamycin A (ConA) or 10 μM MG132 for 6hrs. Lysates were then probed for LRIG1, Vimentin and Actin. Samples pre- and post-Twist induction were run on the same blot and are directly comparable. (C) Quantification of data shown in (B) with LRIG1 on the left and Vimentin on the right. Data are presented as mean ± SEM, collected from 3 independent experiments. (* = p<0.05 by Student’s t-test).

