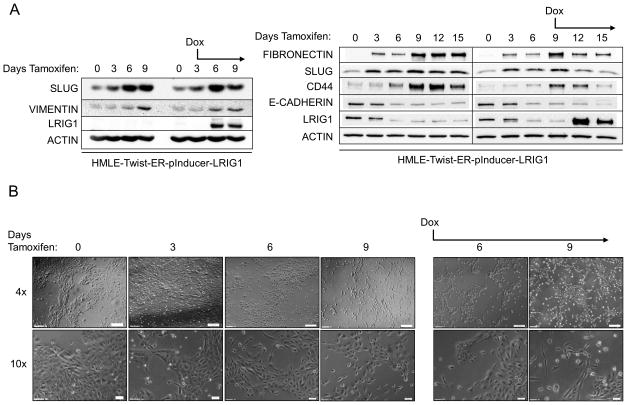
Figure 6. LRIG1 induction in HMLE-Twist-ER cells limits expression of EMT markers.
(A) Western blot analysis of HMLE-Twist-ER-pInducer-LRIG1 cells. “Days Tamoxifen” indicates days of Twist induction. “Dox” indicates when LRIG1 expression was induced with Doxycycline. Total cell lysates were blotted as indicated. (B) Images (4x and 10x objective) of HMLE-Twist-ER-pInducer-LRIG1 cells treated with Tamoxifen to induce Twist (left) or with Tamoxifen and Doxycycline on the indicated day (Day 3, right). All data are representative of at least 3 independent experiments. Scale bar = 200 μm for 4x images, 20 μm for 10x images.

