. 2016 Mar 14;5:e12242. doi: 10.7554/eLife.12242

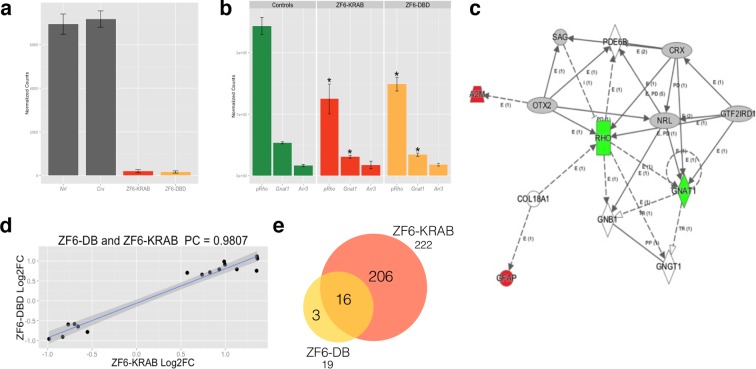
Figure 2. Photoreceptor delivery of ZF6-DB resulted in reduced genome-wide transcript perturbations.

(a) RNA-Seq expression levels (Mean Normalized Counts) comparison between 2 endogenous TFs (Crx and Nrl) and the expression levels resulting from transduction of AAV8-CMV-ZF6-DB and AAV8-CMV-ZF6-KRAB, 15 days after retinal delivery (AAV8-CMV-ZF6-DB n= 6; AAV8-CMV-ZF6-KRAB n= 4 and 7 controls, non-transduced area). (b) Rho and rod Gnat1 and Cone Arrestin 3 expression levels in treated and control retina. (c) Ingenuity Pathway Analysis of DEGs after ZF6-DB AAV delivery in porcine retina showed a network of 13 genes. The 2 phototransduction genes RHO and GNAT1 are shown in green (down-regulated) whereas the 2 genes associated with primary inflammatory response network, A2M and GFAP, are up-regulated (red). (d) Transcriptional activation and repression concordances among Log Fold Changes of the genes in common (Swaroop et al., 2010) between ZF6-DB and ZF6-KRAB (Pearson Correlation Test; PC=0.9787; p value << 1x10⁻⁵). (e) Venn Diagrams, pairwise intersection of the 2 sets of Differentially Expressed Genes (DEGs). An adjusted p value (False Discovery Rate; FDR ≤ 0.1), without filtering on fold change levels, resulted in 19 and 222 DEGs, in ZF6-DBD and ZF6-KRAB treated retina, respectively. The intersection resulted significant by hypergeometric test (p value << 1x10⁻⁵).

DOI: http://dx.doi.org/10.7554/eLife.12242.005

Figure 2.

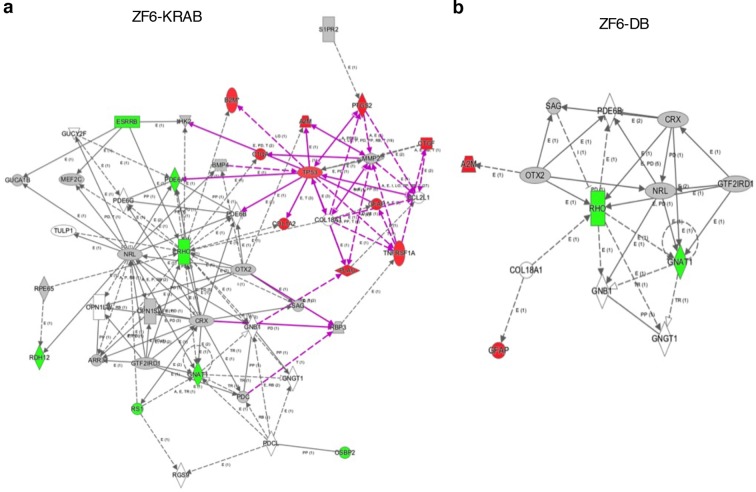
Figure 2—figure supplement 1. Ingenuity Pathway Analysis on DEGs of ZF6-KRAB treated retina.

Figure 2—figure supplement 1.

(a) Delivery of AAV8-CMV-ZF6-KRAB resulted in up-regulation of 10 genes associated with inflammatory responses (red, up-regulation) and the down-regulation (green) of 7 genes associated with the rod phototransduction cascade. (b) the ZF6-DB pathway analysis (Figure 2) is reported for comparison.

Figure 2—figure supplement 2. Determination of the binding constants of ZF6-KRAB and ZF6-DB.

Figure 2—figure supplement 2.

(a) Gel mobility shift titrations of ZF6-KRAB and ZF6-DB with the hRHO 65 bp oligonucleotide (see 'Materials and methods'). (b) In the saturation binding experiments the nanomolar concentration of specific binding data was plotted against of nanomolar increasing concentration (130, 135, 145, 150, 165, 170, 175, 180, 190, and 200 nM, respectively) and (145, 150, 170, 175, 195, 210, 220, 225, 240, and 250 nM, respectively) of DNA ligand and Scatchard analysis of the gel shift binding data. The ratio of bound to free DNA is plotted versus the nanomolar concentration of bound DNA in the reaction mixture. The ZF6-KRAB and ZF6-DB apparent dissociation constants (Kd ZF6-KRAB = 108.00 ± 11.78 nM (R2 = 0.97) and Kd ZF6-DB = 41.94 ± 3.45 nM, R2 = 0.96), respectively) were determined. (c) combination of the a and b panels.