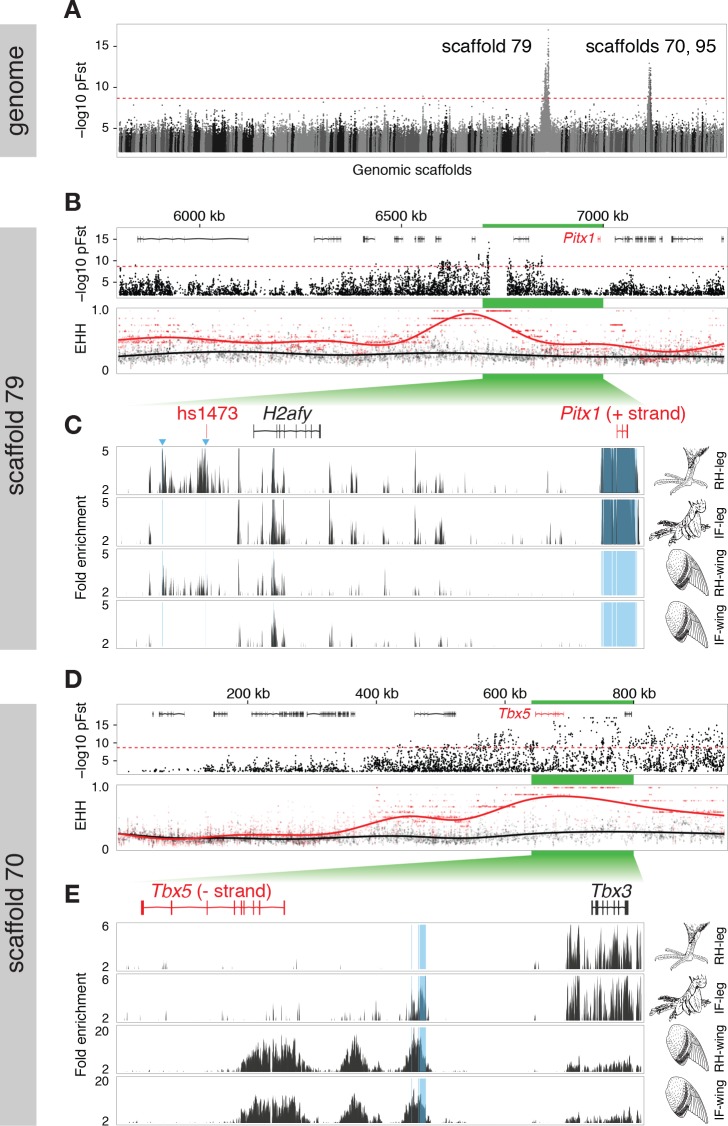
Figure 2. Two regions of genomic differentiation and H3K27ac enrichment distinguish scale- and feather-footed pigeons.
(A) Whole-genome pFst comparisons between genomes of feather-footed and scale-footed pigeons. Scaffolds are ordered by genetic position in a linkage map from an F2 cross (see Figure 1). Dashed line, genome-wide significance threshold. (B) pFst and extended haplotype homozygosity (EHH) plots for region of high differentiation on scaffold 79. Feather-footed birds (n=10, red in EHH plot) homozygous for a 44-kb deletion are differentiated from scale-footed birds (n=28, black) and show extended haplotype homozygosity in this region. Smoothed lines follow a generalized additive model (Wickham, 2009). (C) H3K27ac ChIP-seq enrichment differed significantly between embryonic wing and leg buds of the scale-footed racing homer (RH) in several regions (blue shading), including within a 44-kb interval that is deleted in the muffed Indian fantail (IF; blue arrowheads). This deleted region is orthologous to a known human limb enhancer (hs1473). (D) Selection scans show similar patterns of differentiation on scaffold 70 between muffed (n=11, red in EHH plot) and scale-footed birds (n=28, black). (E) H3K27ac ChIP-seq enrichment differed significantly between leg buds of racing homer and Indian fantail embryos in regions immediately 5’ of Tbx5 (blue shading). Foot and wing drawings modified after Levi (1986).
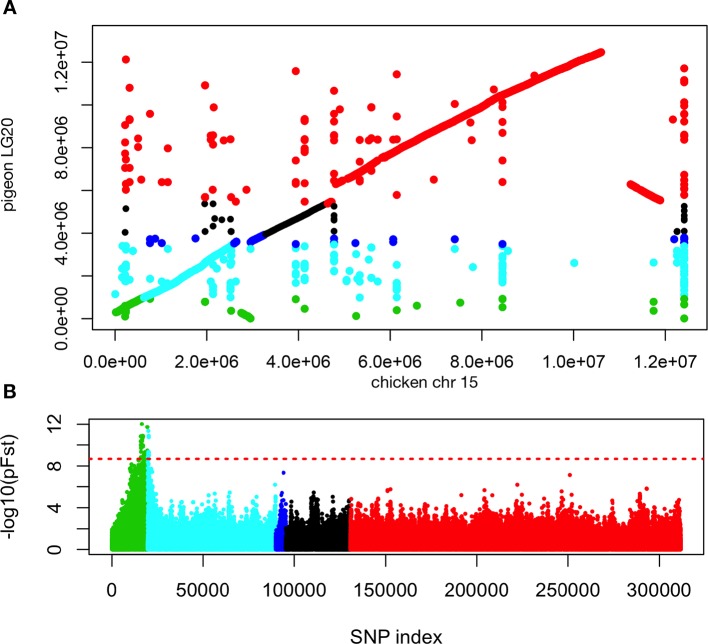
Figure 2—figure supplement 1. Synteny and genomic differentiation of pigeon LG20.
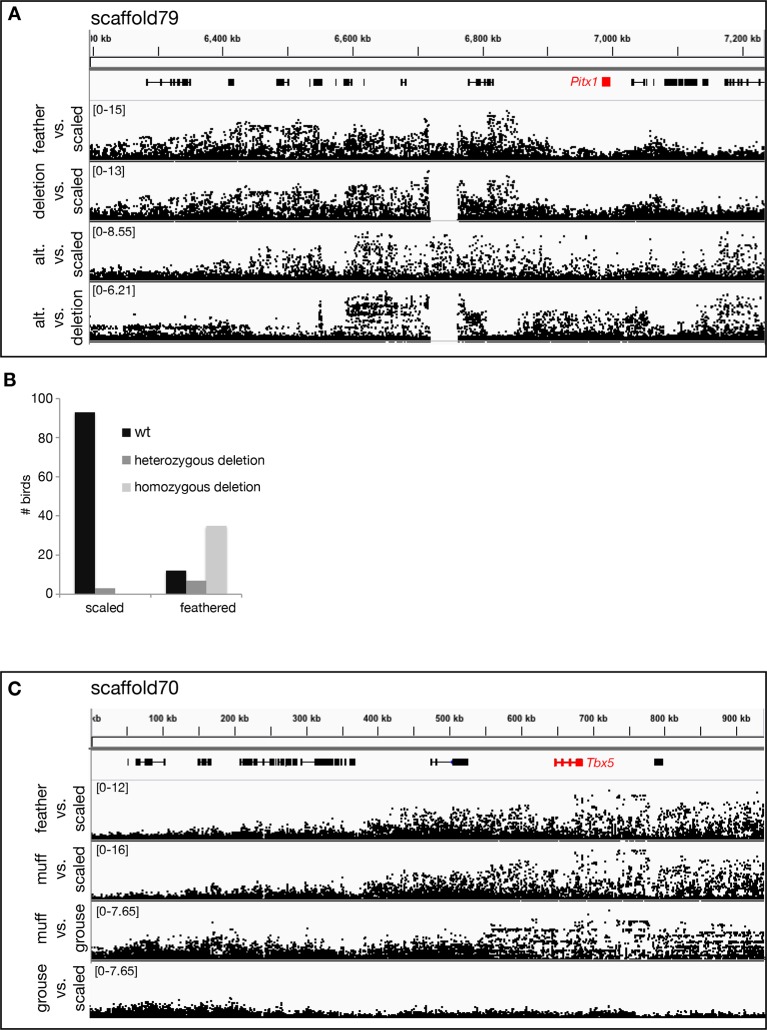
Figure 2—figure supplement 2. Genomic association scans.
Figure 2—figure supplement 3. Haplotype diagram of scaffold 70 candidate interval.


