. 2016 Mar 16;5:e09862. doi: 10.7554/eLife.09862

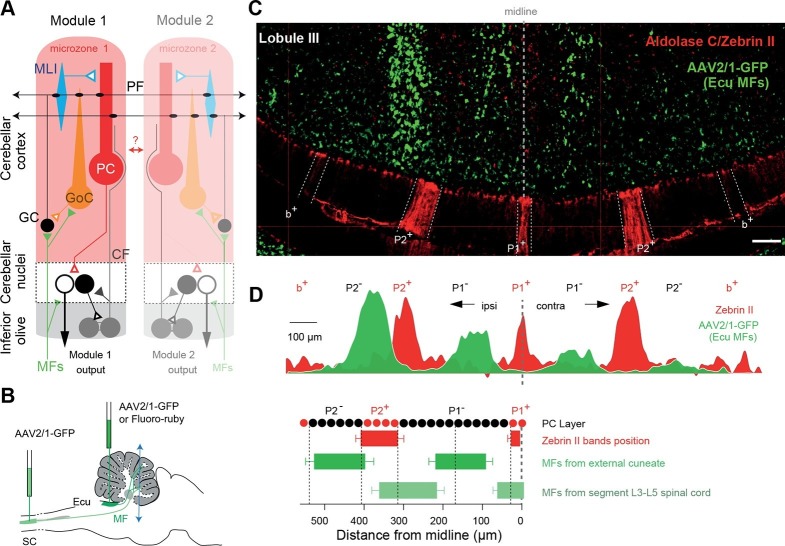
Figure 1. Identification of anatomical cortical microzones by the zebrin II bands (A) Diagram of two cerebellar modules.

One module is composed of a cortical microzone (light red area), the target area of Purkinje cells (PC, red) in the cerebellar nuclei (black and white cells) and a group of olivary cells (gray) sending their climbing fibers (CF, gray line) to the cortical microzones and cerebellar nuclei. Mossy fibers (MFs, green lines) send sensorimotor information to the cerebellar nuclei and the microzones. The parallel fibers (PFs), the axon of granule cells (GCs), cross several microzones belonging to different modules. The red double arrow between the two modules illustrates intermodular communication. GoC: Golgi cell; MLI: molecular interneuron; filled triangles indicate excitatory synapses; empty triangles indicate inhibitory synapses. (B) Diagram illustrating AAV2/1-GFP or fluoro-ruby injection (green pipettes) sites in the external cuneate nucleus (ECu) and in segment L3–L5 of the spinal cord (SC). The blue double arrowhead line indicates the localization of the coronal section shown in panel C. (C) Coronal section across lobule III of the cerebellar cortex showing GFP fluorescence in MF rosettes following viral injection in the external cuneate nucleus (Ecu-MFs, green), aligned with anti-aldolase C/zebrin II (ZII, red) immunostaining. White dotted lines highlight positive zebrin II bands (P1+, P2 and b+ from the midline). (D) Upper panel, superimposed intensity plot profiles of the molecular layer (red) and granule cell layer (green) section shown in C illustrating bilateral MF projections. Upper labels, positive and negative zebrin bands. Black dotted line, midline. Lower panel, summary of MF inputs projection pattern in vermal lobule III from external cuneate (13 slices/4 animals) and spinal cord (4 slices/1 animal) compared to zebrin II bands (two positive bands: P1+, P2+ in red; and two negative bands: P1 and P2).

DOI: http://dx.doi.org/10.7554/eLife.09862.003

Figure 1.

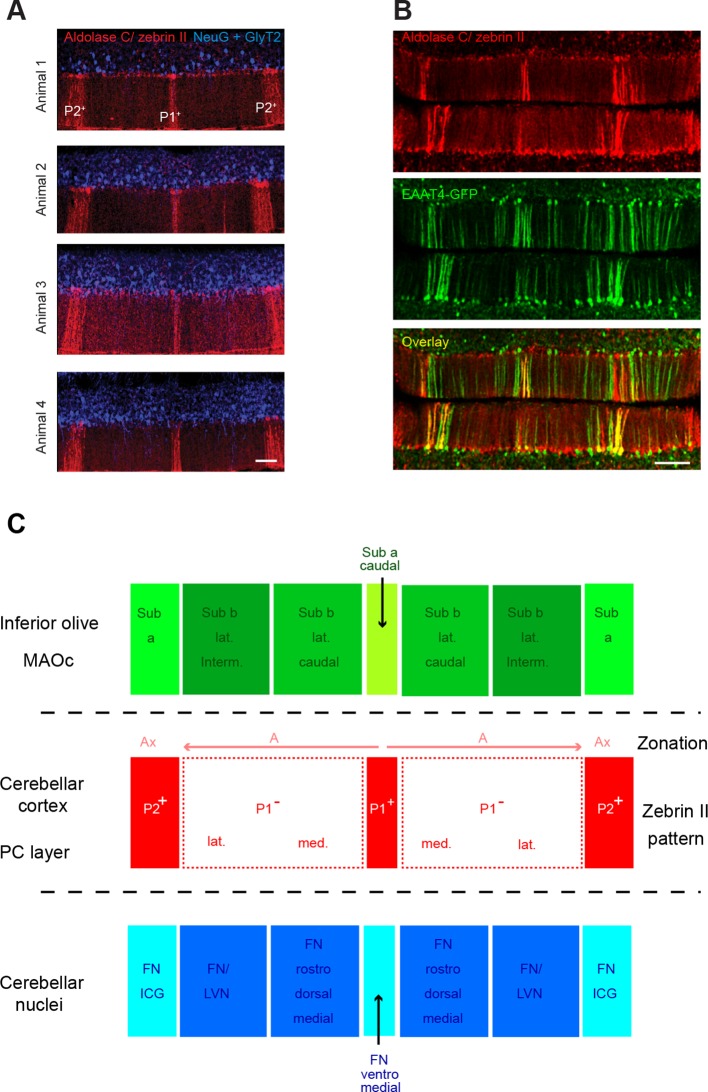
Figure 1—figure supplement 1. Zebrin bands as an accurate positioning tool.

Figure 1—figure supplement 1.

(A) Immunolabeling against aldolase C/zebrin II (red), neurogranin and GlyT2 (both in blue) in the vermis of lobule IV from four different animals. Neurogranin and GlyT2 label Golgi cells (GoCs). Note the stereotyped zebrin band pattern. (B) The EAAT4-GFP transgenic mice express GFP in zebrin II-positive bands. Top: immunolabeling for aldolase C/zebrin II (red) in a slice from an EAAT4-GFP mouse. Middle: GFP fluorescence in the same slice. Bottom: overlay. Scale bar, 100 μm. (C) Diagram illustrating the topographical organization of climbing fiber (CF) inputs to the cerebellar cortex (green boxes refer to inferior olive subregions) and the partial match with the zebrin band patterning (red boxes refer to zebrin bands) and the cortico-nuclear projection to cerebellar nuclei (blue boxes refer to nuclear subregions). The olivo-cortico-nuclear loop defines the cerebellar module. Note that P1 is split onto two subregions. The array of CF projection in the cerebellar cortex and the cortico-nuclear projections define the microzone. MAOc: caudal medial accessory olive; Sub a: subnucleus a of the MAOc; Sub b lat. interm.: intermediate part of the lateral subnucleus b of the MAOc; Sub b lat. caudal: caudal part of the lateral subnucleus b of the MAOc; Sub a caudal: caudal part of subnucleus a of the MAOc. Ax and A zones refer to the zonal nomenclature of the olivo-cortical pathway (Voogd, 1967). FN/ICG: fastigial nucleus and interstitial cell group; FN/LVN: fastigial nucleus and lateral vestibular nucleus. Adapted from Sugihara, 2011 and Voogd and Ruigrok, 2004.
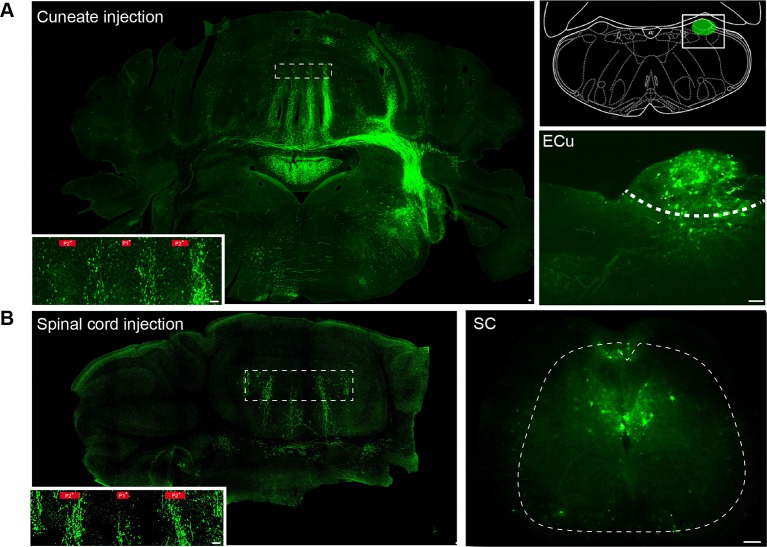
Figure 1—figure supplement 2. Mossy fiber projections from the external cuneate nucleus and spinal cord (segment L3-L5).

Figure 1—figure supplement 2.

(A) Section from the cerebellum and the brainstem after AAV2/1 injection of viruses into the external cuneate nucleus. Inset: mossy fiber rosettes in lobule III. Zebrin band boundaries are shown in red. Right panel: diagram illustrating the position of the external cuneate injections (ECu). Bottom right: example of injection site in the external cuneate nucleus and infected neurons. (B) Section from the cerebellum after injection of AAV2/1 viruses into the spinal cord. Inset: mossy fiber rosettes in lobule III. Zebrin band boundaries are shown in red. Right: injection site and infected neurons in the spinal cord (SC) (see Materials and methods).