. 2016 Mar 16;5:e09862. doi: 10.7554/eLife.09862

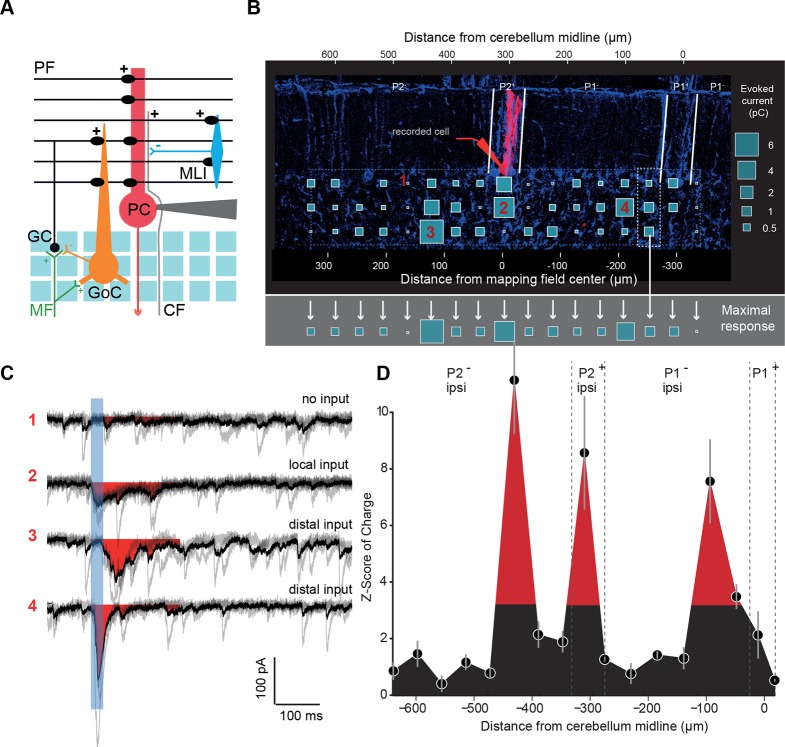
Figure 2. Granule cell input patterns to Purkinje cells reveal hotspots of connectivity.

(A) Experimental design and simplified diagram of the cortical microcircuit. Purkinje cell (PC) synaptic inputs were recorded. Photorelease of RuBi-glutamate at multiple locations of the granule cell (GC) layer (blue squares) mimics GC (black) activation by mossy fibers (MFs; green). GCs contact PCs, Golgi cells (GoCs; orange) and molecular interneurons (MLIs; blue) along the mediolateral axis. Inhibition is blocked and climbing fibers (CFs) are not activated. PF: parallel fibers. (B) Example of a PC (red) recorded in an EAAT4-GFP acute cerebellar slice and filled with biocytin. The recorded cell was reconstructed and located using both GFP expression (not shown) and aldolase C immunolabeling (blue). The PC in this example is located in the P2+ zebrin band. Blue squares indicate uncaging sites. The size of the square is proportional to the synaptic charge of the evoked current. Mediolateral response is given by the strongest response at all depths of the GC layer (i.e. maximal response in the white dotted box). Maximal responses along the mediolateral axis are reported in the gray area and define the connectivity pattern. The blue dashed box indicates the width of the photostimulation field. Please note the two scales: at the bottom is the distance from the recorded cell, while at the top is the distance to the midline. (C) Examples of evoked currents, from panel B. The blue bar indicates uncaging duration. The red area indicates the measured charge (window = 200 ms). (D) The connectivity pattern was expressed as the Z-score of charge, as a function of the distance to the cerebellar midline. The significance threshold was defined at Z = 3.09. Red areas are considered as functionally connected, while black areas indicate silent sites. Error bars illustrate the median from five mappings.

DOI: http://dx.doi.org/10.7554/eLife.09862.006

Figure 2.

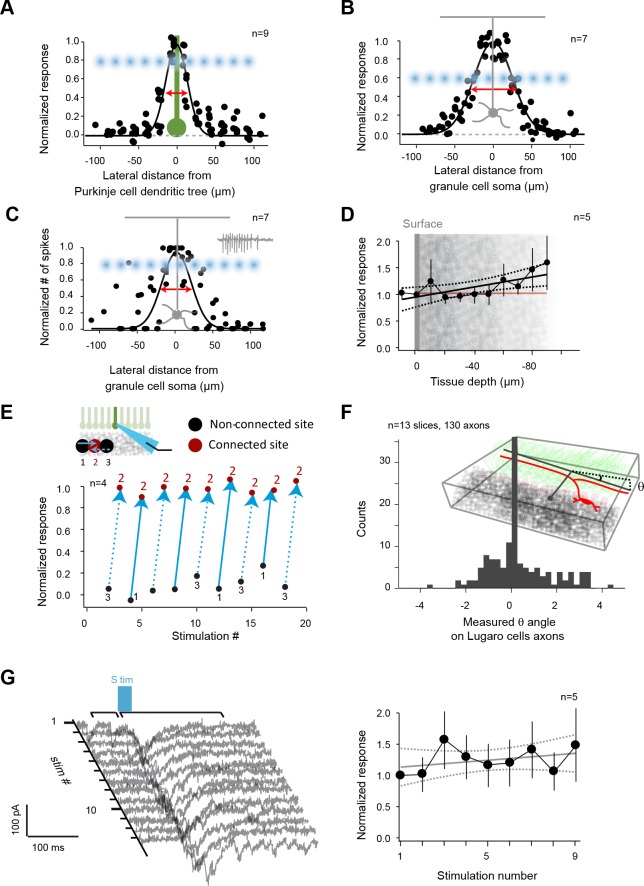
Figure 2—figure supplement 1. Controls for photostimulation.

Figure 2—figure supplement 1.

(A) Normalized direct current extent in Purkinje cells (PCs) when the spot of illumination (blue dots) is moved through PC dendrites (green); illumination step: 20 μm. (B) Normalized direct current extent in granule cells (GCs) when the spot of illumination is moved through GC dendrites (step: 20 μm). (C) Normalized number of spikes elicited in GCs when the spot of illumination is moved through GC dendrites (step: 20 μm). (D) Normalized direct current response in GCs as a function of focal plane depth in slices. (E) Evaluation of independence between neighboring sites. Site 2 evoked a current in a recorded PC, but not sites 1 or 3, although they are direct neighbors. All three sites are alternatively stimulated to test for a possible spread of glutamate between sites or desensitization of glutamate receptors on site 2. (F) Distal silent sites might be due to a tilt in the slice. Slice angle was verified using Lugaro cell axons that parallel GC axons in Glyt2-GFP mice in order to rule out this hypothesis. (G) Left panel: a responding site was repetitively photostimulated to test the stability of recorded responses throughout mappings. Right panel: measured synaptic charge versus time.
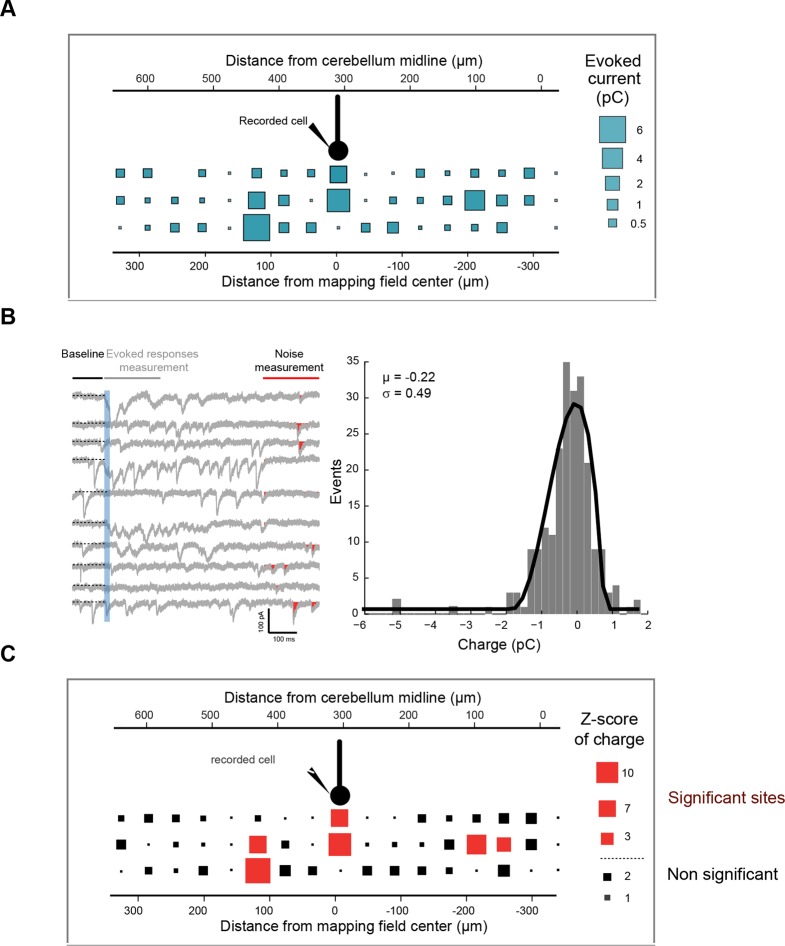
Figure 2—figure supplement 2. Z-score representation of the granule cell input map in one recorded cell.

Figure 2—figure supplement 2.

(A) Initial connectivity maps were built by determining the synaptic charge elicited by granule cells at a given site. (B) In each trial, light-evoked responses (at 200 ms) and noise (at 800 ms) were measured and a histogram of the noise was built for each cell. The mean and standard deviation of the noise were determined and used to calculate the Z-score at each site (C) using the following equation: Z-score = (mean of synaptic charge at a given site − mean of noise distribution in the cell)/standard deviation of the distribution of noise. A Z-score of 3.09, corresponding to a significance level of 0.001, was chosen to define significant and silent sites.