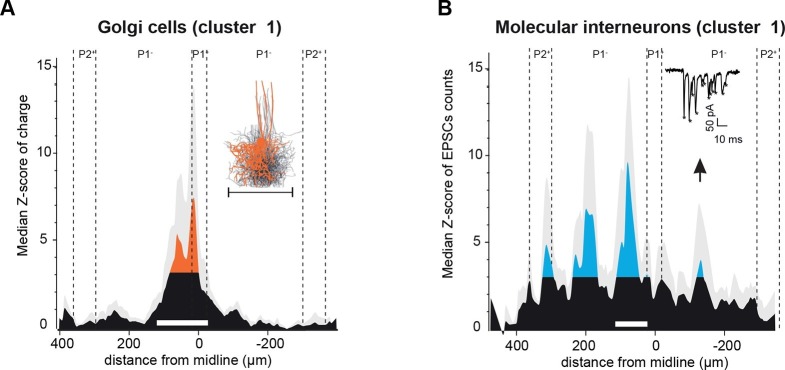
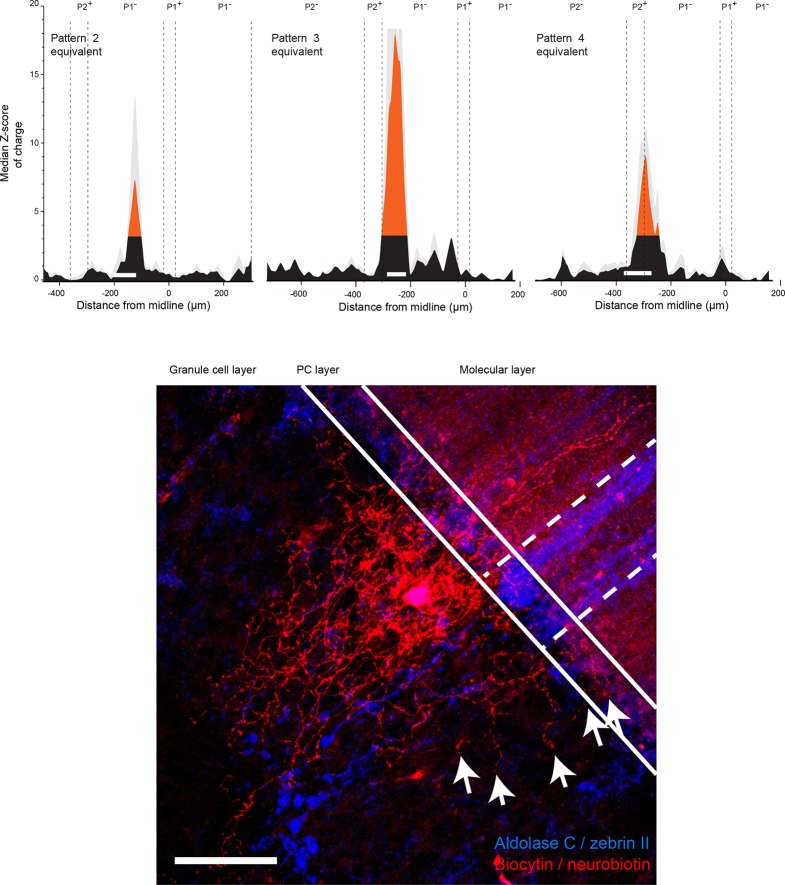
Figure 5. Spatial organization of granule cell (GC) input patterns to molecular interneurons and Golgi cells is distinct from GC input maps to Purkinje cells.
(A) Median granule cell (GC) input pattern to Golgi cells (GoCs; Z-score of charge) for GoCs located at the same location as Purkinje cells (PCs) from cluster 1. Black: Z-score <3.09, orange: Z-score >3.09. Error bars are in light gray. Inset: overlay of all 3D-reconstructed GoCs, showing the extension of the axonal plexus, that is, the maximal region in which GoCs could inhibit GCs (same scale as the median pattern). (B) Median GC input pattern to molecular interneurons (MLIs; Z-score of number of excitatory post-synaptic currents, EPSCs) at the same position as PCs from cluster 1. The upward arrow indicates a hotspot of GCs contacting MLIs located in the cluster 1 region, but not PCs. Inset: example of EPSCs recorded following photostimulation. Stars indicate detected EPSCs.


