Figure 6. Sestrin2 loss increases mTORC1 signaling in colon cancer.
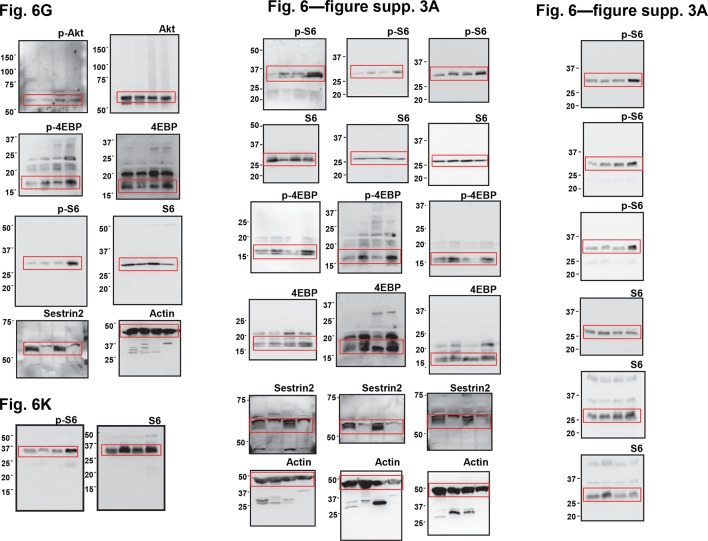
(A-D) 3-month-old WT and Sesn2-/- mice (n=11 each) were subjected to lethal irradiation and injected with bone marrow cells from age-matched Sesn2-/- (Sn2→WT) and WT (WT→Sn2) mice, respectively. After 1 month, mice were subjected to AOM/DSS administration as indicated in Figure 5B. After completion of the experiment, colons were examined under a dissection microscope (A), and tumor number (B), colon length (C) and tumor size (D) were analyzed and presented as mean ± s.e.m. (E, F and J) Colon tumor (T) and normal colon (N) tissues of indicated mice were subjected to immunohistochemistry of phospho-Ser235/236-S6 (E and J) or phospho-Thr37/46-4E-BP (F). (G-I, K and L) Colon tumor (T) and normal colon (NT) tissues of WT and Sesn2-/- (S2) mice (G-I), as well as WT→Sn2 and Sn2→WT mice (K and L), were subjected to immunoblotting of indicated mTORC1 and mTORC2 signaling markers (G and K). Relative band intensities were quantified through densitometry and presented as mean ± s.e.m (H, I and L; n=6 in each group). *p<0.05, ***p<0.001. P values are from Student’s t-test. Scale bars, 200 μm. Molecular weight markers are indicated in kDa.
Figure 6—figure supplement 1. Efficiency of bone marrow transplantation.

Figure 6—figure supplement 2. Additional immunohistochemistry results for Figure 6E (A), Figure 6F (B) and Figure 6J (C).
Figure 6—figure supplement 3. Additional immunoblotting results for Figure 6G (A) and Figure 6K (B).


