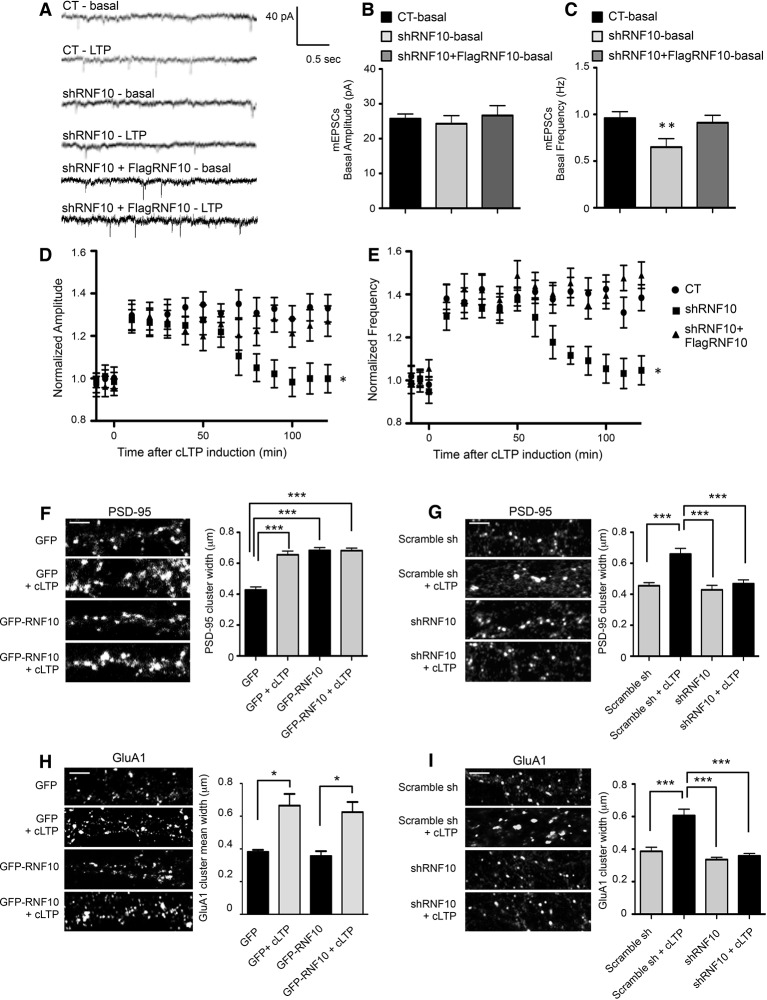
Figure 11. Down-regulation of RNF10 expression prevents cLTP expression.
(A) mEPSCs recorded at -60 mV before (basal), and after cLTP induction in hippocampal neurons transfected or not (CT) with shRNF10 or with shRNF10 + FlagRNF10. (B, C) Basal amplitude (B) and frequency (C) of mEPSCs, prior cLTP induction (**p<0.01, shRNF10 vs CT). (D, E) Time-course of amplitude (D) and frequency (E) of mEPSC following cLTP induction (*p<0.05, shRNF10 vs CT). (F, H) Effects of RNF10 overexpression on cLTP-induced modifications of dendritic spine morphology. Confocal images of hippocampal neuron dendrites (DIV14) transfected at DIV7 with GFP or GFP-RNF10, treated for cLTP induction and immunolabeled for PSD-95 (F) or GluA1 (H); scale bar: 4 μm. The histograms show the quantification of PSD-95 (F) and GluA1 (H) clusters width (PSD-95: n=6, ***p<0.001; GluA1: n=8–10, *p<0.05; one-way ANOVA, followed by Bonferroni post-hoc test). (G, I) Effects of RNF10 silencing on cLTP-induced modifications of dendritic spine morphology. Confocal images of hippocampal neuron dendrites (DIV14) transfected at DIV7 with scramble sh or shRNF10, treated for cLTP induction and immunolabeled for PSD-95 (G) or GluA1 (I); scale bar: 4 μm. The histograms show the quantification of PSD-95 (G) and GluA1 (I) clusters width (PSD-95: n=6, ***p<0.001; GluA1: n=8–10, ***p<0.001; one-way ANOVA, followed by Bonferroni post-hoc test).

