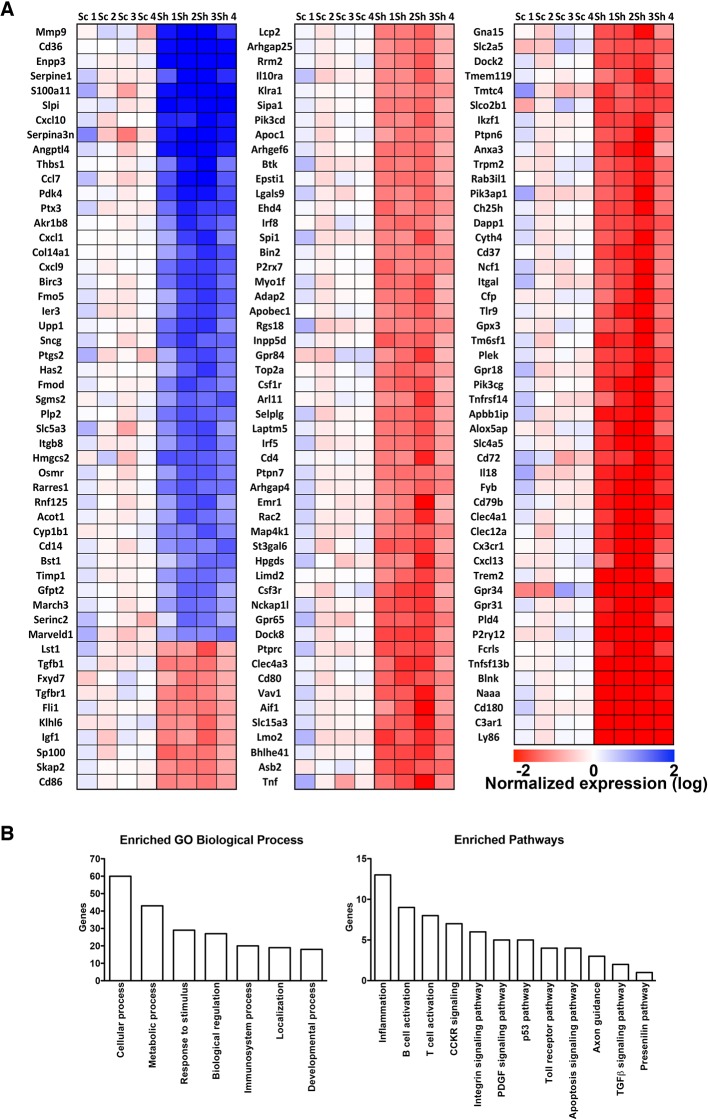
Figure 5. Heat map and gene ontology of differentially expressed genes identified in microarray experiments.
(A) Heat map of differentially expressed genes. Expression data are reported as log2 and blue color indicates high expression values and red color low expression value. Sc represents the different scramble control (1–4), while Sh represents the shRNA against RNF10 (5–8). (B) Gene ontology analysis of biological processes and enriched pathways analysis of differentially regulated genes in absence of RNF10.

