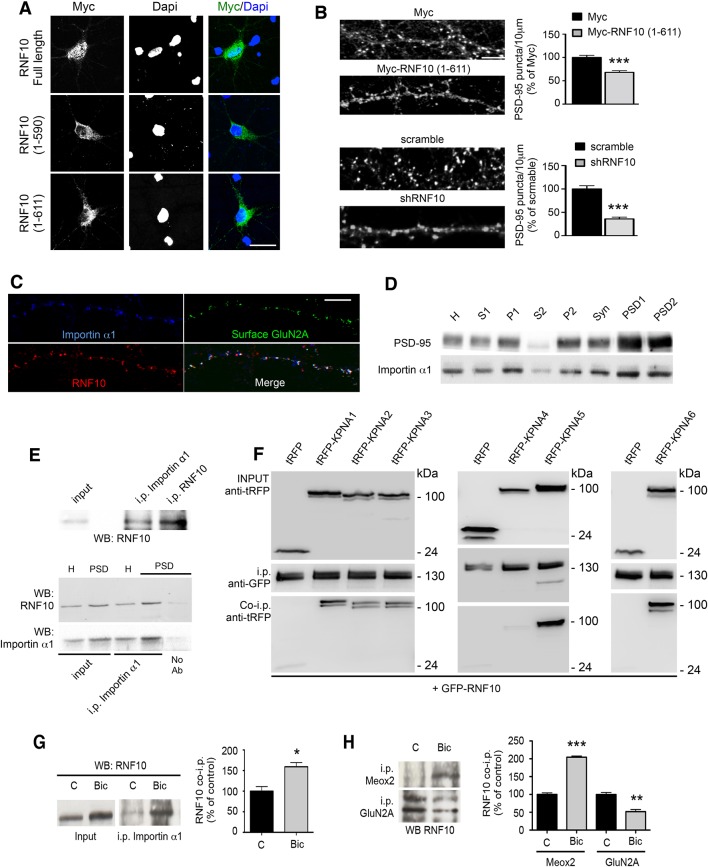
Figure 7. RNF10 translocates into the nucleus through NLS2-dependent interaction with importin α1.
(A) Confocal images of primary hippocampal neurons transfected with Myc-RNF10 full-length (FL) or Myc-RNF10 truncated mutants and immunolabeled for Myc (green) and Dapi (blue); scale bar: 20 μm. (B) Primary hippocampal neurons transfected with Myc, Myc-RNF10 (1–611), pGIPZ-scramble or with shRNF10 were immunolabeled (DIV14) for PSD-95. The histograms show the quantification of PSD-95-positive puncta expressed as % of Myc (upper histogram) or scramble (lower histogram) transfected neurons (n=50–88, ***p<0.001, Myc-RNF10 (1–611) vs Myc and shRNF10 vs scramble; unpaired Student’s t-test); scale bar: 4 μm. (C) Confocal images of dendrites of hippocampal neurons (DIV14) immunolabeled for RNF10 (red), surface GluN2A (green) and importin α1 (blue); scale bar: 4 μm. (D) Importin α1 and PSD-95 protein levels were analyzed by means of WB analysis in various subcellular compartments purified from rat hippocampal tissue (H: Homogenate fraction, S1: supernatant 1, P1: nuclear fraction, S2: cytosolic fraction 2, P2: crude membrane fraction 2, Syn: synaptosomal fraction, PSD1: Triton insoluble postsynaptic fraction, PSD2: postsynaptic density fraction). (E) Representative co-i.p. assay showing the interaction between RNF10 and importin α1 in hippocampal tissue homogenate (upper and lower panel) and PSD fraction (lower panel). No Ab lane: control lane in absence of the antibody. WB analysis was performed with RNF10 and importin α1 antibodies. (F) RNF10-tagged with GFP was co-expressed with multiple importin α isoforms (KPNA1-KPNA6) tagged with tagRFP in HEK293T cells. RNF10-GFP was immunoprecipitated from cell extract using anti-GFP MicroBeads. Co-immunoprecipitated importinerase - α isoforms were detected in complex with RNF10 using anti-tagRFP antibodies. (G) Co-i.p. assay performed by using an importin α1 antibody from cell homogenates of control (C) neurons or treated with Bic. WB analysis was performed with RNF10 antibody. The histogram shows the quantification of RNF10/importin α1 interaction expressed as % of control (n=3, *p<0.05; unpaired Student’s t-test). (H) Representative co-i.p. assay from cell homogenates of control (C) neurons or treated with Bic. WB analysis was performed with RNF10 antibody. The histogram shows the quantification of RNF10 interaction with GluN2A and Meox2 expressed as % of control (n=3, ***p<0.001, Meox2, Bic vs control; **p<0.01, GluN2A, Bic vs control; unpaired Student’s t-test).

