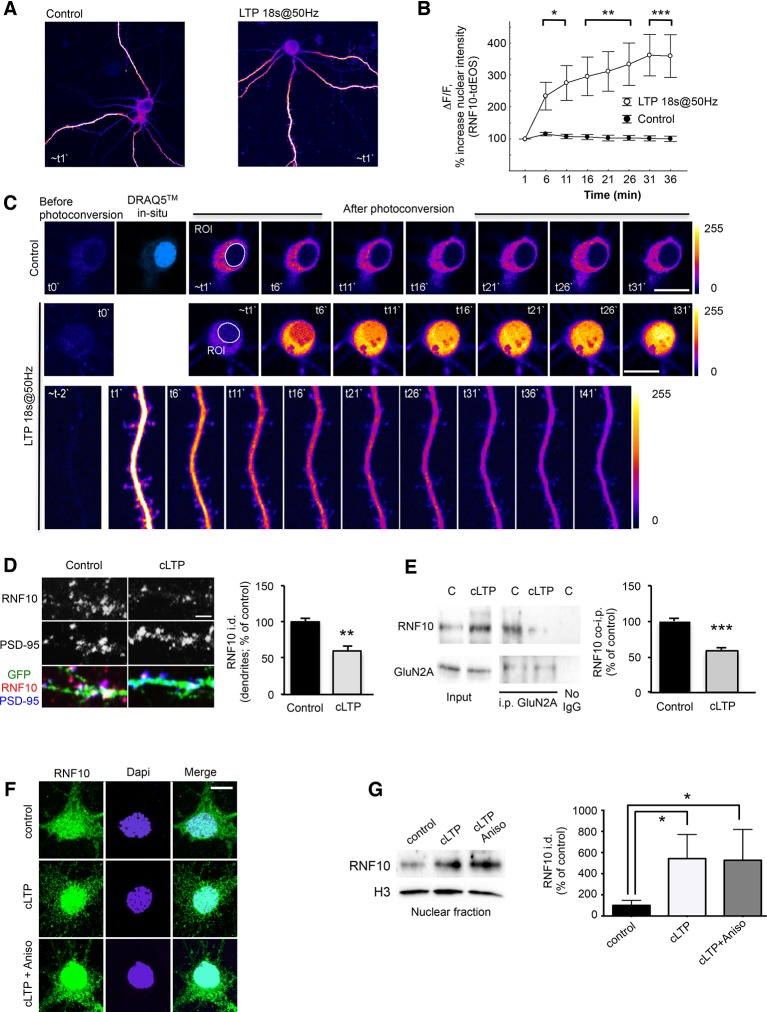
Figure 8. LTP induction triggers RNF10 translocation to the nucleus.
(A–C) RNF10-tdEOS translocates from distal dendrites to the nucleus in mature hippocampal neurons upon high-frequency 18s@50Hz field synaptic stimulation. Distal dendrites (ROIs) selected for photoconversion were illuminated with UV laser (405 nm wavelengths) repetitively through the image z-stack (image t0`). (A) Representative images of control and stimulated RNF10-tdEOS expressing hippocampal neurons illuminated with 568 nm laser excitation wavelength 1 min following photoconversion. (B) The histogram shows a significant increase in RNF10-tdEOS photoconverted fluorescent intensities in the nucleus following high frequency 18s@50Hz field synaptic stimulation (n=9, *p<0.05, **p<0.01, ***p<0.001; unpaired Student’s t-test). (C) Depicted are confocal max intensity projection images of control and stimulated RNF10-tdEOS expressing hippocampal neurons at respective time points after stimulation. Lower panels: magnified image sequence of UV illuminated dendritic segment with multiple spines is represented showing the decrease in distal dendrites upon field stimulation. All experiments were performed in a presence of anisomycin (7.5 µM). (D) Confocal images of dendrites of hippocampal neurons (DIV14) transfected with GFP (green) to visualize neurites and immunolabeled for RNF10 (red) and PSD-95 (blue). The histogram shows the quantification of RNF10 signal in dendrites 2 hr after induction of cLTP (see Materials and methods) expressed as % of control (n=5, **p<0.01; unpaired Student’s t-test); scale bar: 4 μm. (E) Co-i.p. assay from hippocampal extracts performed with an antibody against GluN2A. WB analysis was performed using antibody for RNF10 and GluN2A. The graph shows the effect of cLTP induction on RNF10 interaction with GluN2A expressed as % of control (n=4, ***p<0.001; unpaired Student’s t-test). (F) Representative confocal images of hippocampal neurons (DIV14) after the induction of cLTP in the presence or absence of 7.5 μM anisomycin and immunolabeled for RNF10 (green) and Dapi (blue); scale bar: 10 μm. (G) WB analysis for RNF10 from P1 nuclear fraction purified from hippocampal neurons after the induction of cLTP in the presence or absence of 7.5 μM anisomycin. The histogram shows the quantification of RNF10 integrated density normalized on Histone-H3 (n=4, *p<0.05, control vs cLTP and control vs cLTP+Anisomycin; one-way ANOVA, followed by Tukey post-hoc test).

