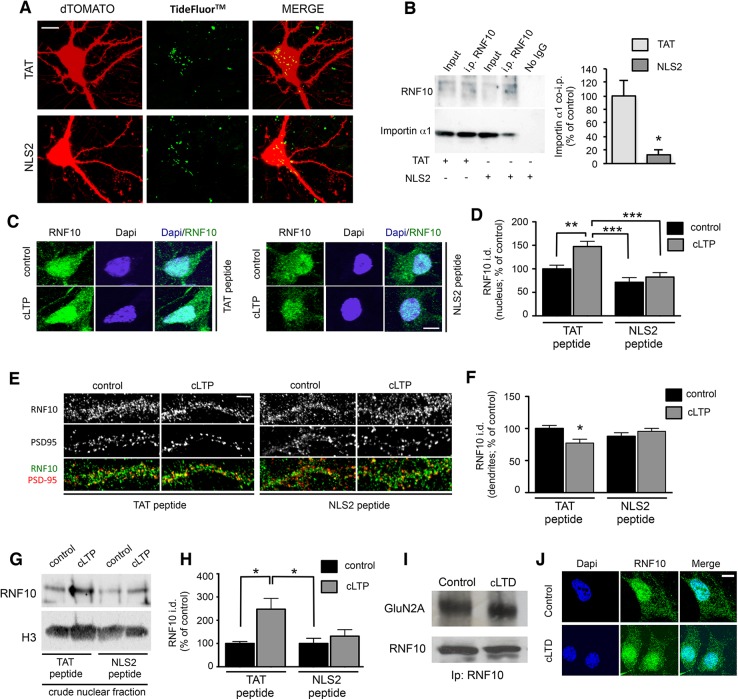
Figure 9. NLS2 peptide but not anysomicin blocks RNF10 accumulation in the nucleus after induction of cLTP.
(A) Confocal images from living hippocampal neurons transfected with dTomato (DIV10) and treated with TAT-TF2 or NLS2-TF2 coniugated peptide (DIV14). Samples were illuminated with 543 nm and 488 nm to visualize respectively neurons and peptide. The representative image shows the presence of peptide (green) within the neuron (red, DTOMATO), demonstrating the capability of crossing the plasmatic membrane; scale bar: 10 μm. (B) Representative co-i.p. assay performed by using anti-RNF10 antibody and showing the interaction between RNF10 and importin α1 in primary hippocampal neurons (DIV14) treated with NLS2 peptide (active) or TAT (control) peptide. No IgG lane: control lane in absence of the antibody. WB analysis was performed with importin α1 and RNF10 antibodies. The histogram shows the quantification of importin α1 interaction with RNF10 expressed as % of control (TAT; n=3; *p<0.05; unpaired Student’s t-test). (C, E) Hippocampal neurons (DIV14) were treated with NLS2 peptide (active) or TAT (inactive) peptide for 24 hr and then cLTP was induced in the presence of the same peptides. Confocal images show the immunolabeling for RNF10 (green) and the staining for Dapi (blue) in the nucleus (C) or PSD-95 (red) along dendrites (E); scale bars: 10 μm (C) and 4 μm (E). (D, F) The histograms show the quantification of RNF10 signal in the nucleus (D) and along dendrites (F) after the induction of cLTP in the presence of TAT or NLS2 peptides expressed as % of control [n=10,11 (D), n=17–19 (F)]; *p<0.05; **p<0.01; *p<0.001; one-way ANOVA, followed by Tukey post-hoc test). (G, H) WB analysis for RNF10 from P1 crude nuclear fraction purified from hippocampal neurons after the induction of cLTP in the presence of NLS2 or TAT peptide (G). The histogram (H) shows the quantification of RNF10 integrated density normalized on Histone-H3 and expressed as % of control (n=4, *p<0.05; one-way ANOVA, followed by Tukey post-hoc test). (I) Representative co-i.p. assay performed with an antibody against RNF10 from cell lysates of hippocampal neurons following induction of cLTD. WB analysis was performed using antibody for RNF10 and GluN2A. (J) Confocal images of the soma of hippocampal neurons (DIV14) treated with a protocol to induce cLTD and then immunolabeled for RNF10 (green) and stained with Dapi (blue). Scale bar: 10 μm.

