
Figure 1.
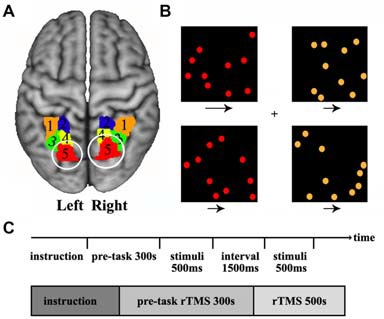
Definition of the posterior superior parietal lobule (SPL) and the visual search task. (A) The posterior SPL was defined using a connectivity-based parcellation approach. The maximum probability map for the SPL subregions was created and the most posterior subregions (red, label 5) in left and right SPL were selected as the target brain sites of transcranial magnetic stimulation (TMS). The labels 1–5 is the five subregions in left and right SPL. (B) The stimulus displayed during a target-present color task trial. The subjects searched the visual display for targets defined by a conjunction of color and motion. Four square windows were used in the experiment. Each window contained 10 dots (orange or red) that moved at two speeds (fast or slow) during the experiment, and the arrows under each window specify the two speeds at which the dots could move. (C) The time courses of the visual stimuli and repetitive transcranial magnetic stimulation (rTMS) stimuli. The rTMS stimuli were applied for 300 s before behavioral task start and continued until the task finished.