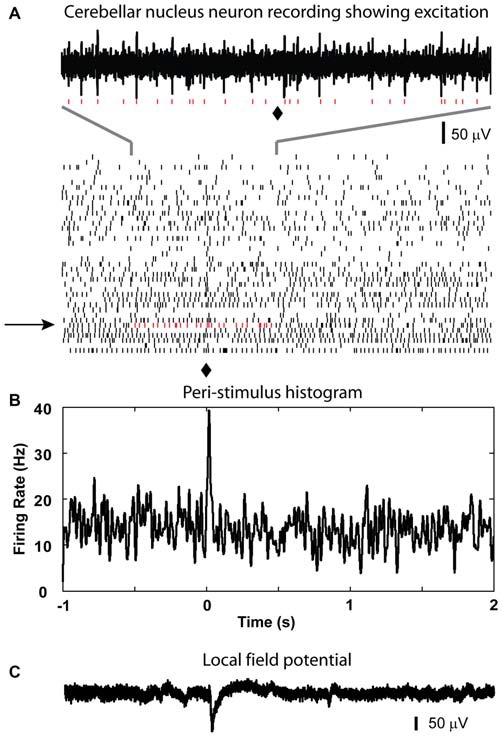
Figure 3.

Excitatory response from CN neuron to optical stimulation in the IO. (A) Raster plot generated using the spikes recorded from a CN neuron at the depth of 2267 μm (40 sample trials, corresponding trial of the example trace is indicated by black arrow, red dots are used to show detected spikes in the example trace). (B) A peri-stimulus histogram (PSTH) plot is constructed to show the response to the light stimulation given at 0 s in the IO (⧫ in raster plot). It demonstrated a weak transient increase in firing rate after the light stimulation. (C) LFP recorded at the same site of the isolated cell.
