
Figure 6.
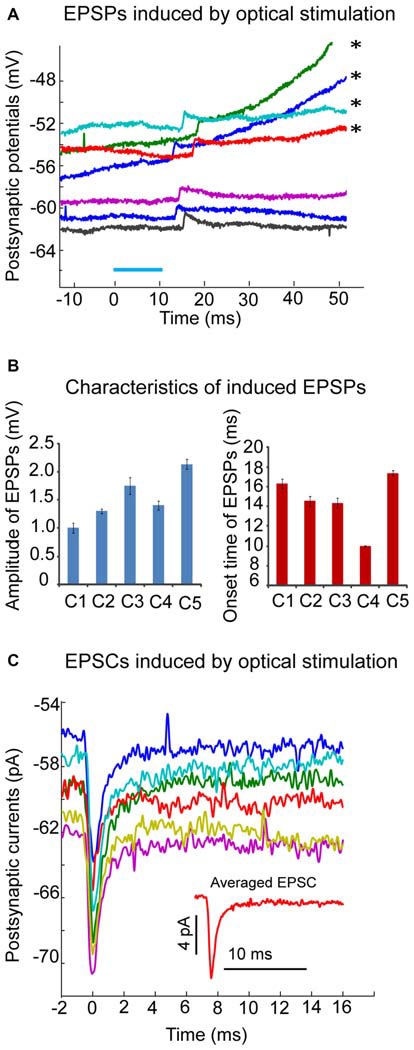
Excitatory postsynaptic responses induced by optical stimulation in CN neurons of transgenic mice. (A) Example of neuron where local optical stimulation (blue light, 10 ms, blue bar), elicits a small EPSP with an average amplitude of 1.8 mV in the presence of GABAzine (10 μM) under current clamp. On the top few traces marked by asterisks, the EPSPs are able to trigger action potentials at a variable delay (not shown); (B) Amplitudes and onset time of optical stimuli-induced EPSPs from 5 individual neurons were plotted in two bar graphs. Note the varying onset time of induced EPSPs; (C) The averaged EPSCs (from 6 trials) induced by optical stimulation in the same CN neuron as the one in panel A under voltage clamp (holding potential is −60 mV). Note the small amplitude (about 7 pA) of the averaged trace of EPSCs (shown in the inset figure). EPSCs were aligned to their peaks at time 0.