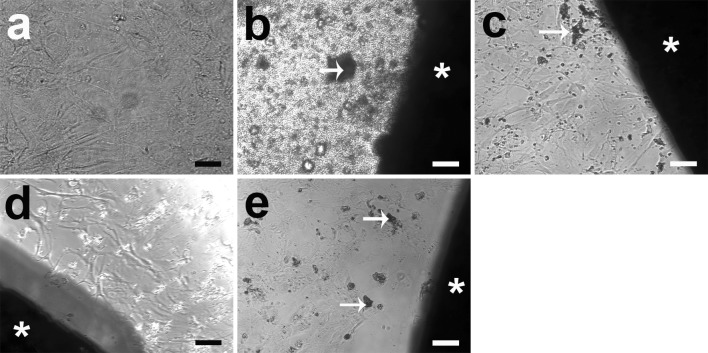
Fig. 4.
Morphology of osteogenic differentiating HRD at 28 days: a control group, the well is densely covered with cells; b pure Mg, few cells compared with control; c Mg2Ag, the well is densely covered with cells; d Mg10Gd, the well is densely covered with cells; e WE43, the well is densely covered with cells. Asterisk magnesium disc, arrows products of degradation. Scale bar 100 µm

