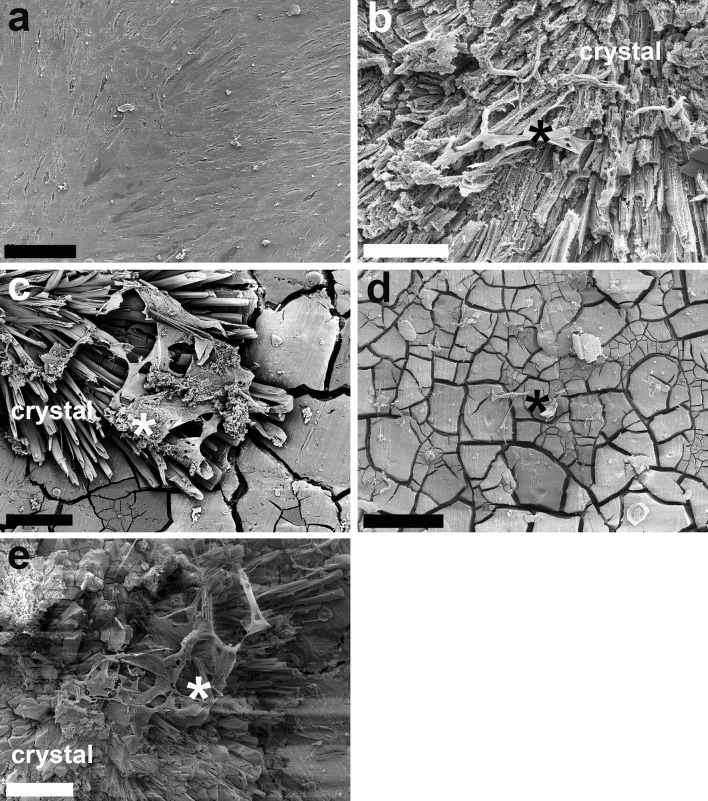
Fig. 6.
SEM analysis at day 7: a control, densely covered with HRDs (scale bar 100 µm); b pure Mg, c Mg2Ag, d Mg10Gd, e WE43. Note crystal formation on material surface in b–e, and cell attachment to the crystal compared with the smooth surface in d. Cells are marked with an asterisk. Scale bar in b–e 5 µm

