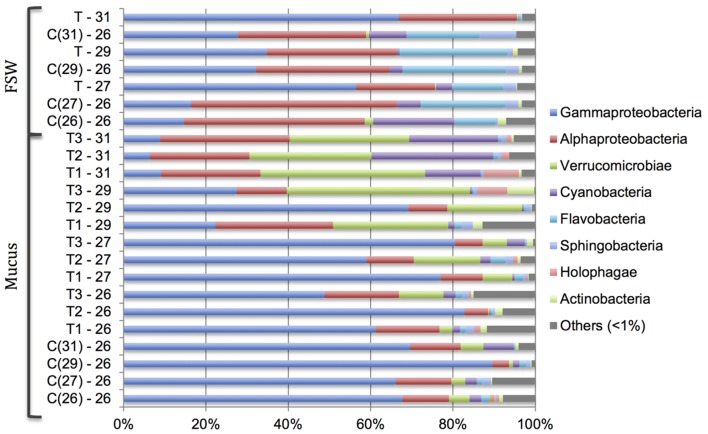
FIGURE 3.
Changes in relative abundance of bacterial community at the class level in the Acropora muricata coral mucus (Mucus) and filtered seawater (FSW) from 26 to 31°C. Control tanks (C) and treatment tanks (T) and numbers represents the respective temperatures. Numbers in the ( ) in the control samples (C) represent the respective treatment temperature. For example, C(31) – 26 represents control sample at 26°C when the temperature in the treatment tanks were 31°C.

