Figure 5.
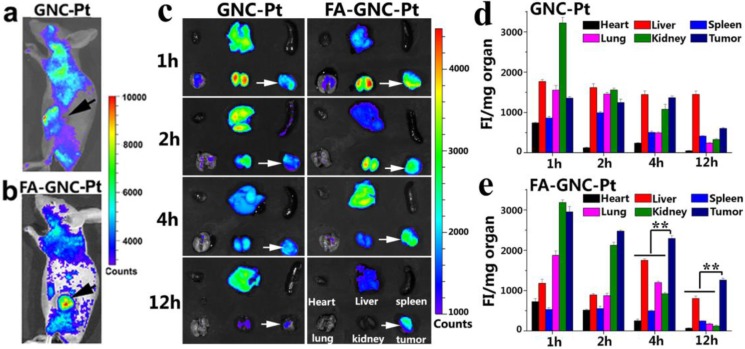
In vivo and ex-vivo fluorescence imaging and organ distribution of the FA-GNC-Pt or GNC-Pt nanoparticles in 4T1 tumor-bearing nude mice. (a&b) Representative fluorescence images for in vivo distribution of (a) GNC-Pt and (b) FA-GNC-Pt nanoparticles examined 2 h post i.v. injection; (c) Ex-vivo distribution of the GNC-Pt and FA-GNC-Pt nanoparticles examined at different time points post injection (the white arrows showed the location of tumor, the organs layout was shown in right bottom and applied for ex-vivo images); (d&e) Semi-quantitative analysis of (d) GNC-Pt or (d) FA-GNC-Pt distribution in the major organs as determined by normalizing the fluorescence intensity with the organ mass (** p < 0.01).

